
Download the full report (PDF)
Snapshot
| Item | Value |
|---|---|
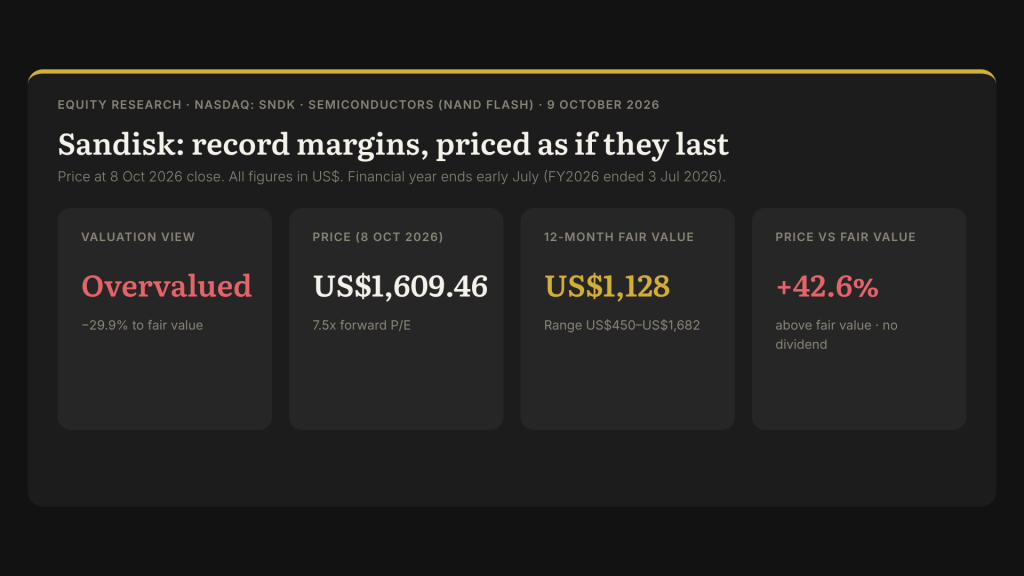
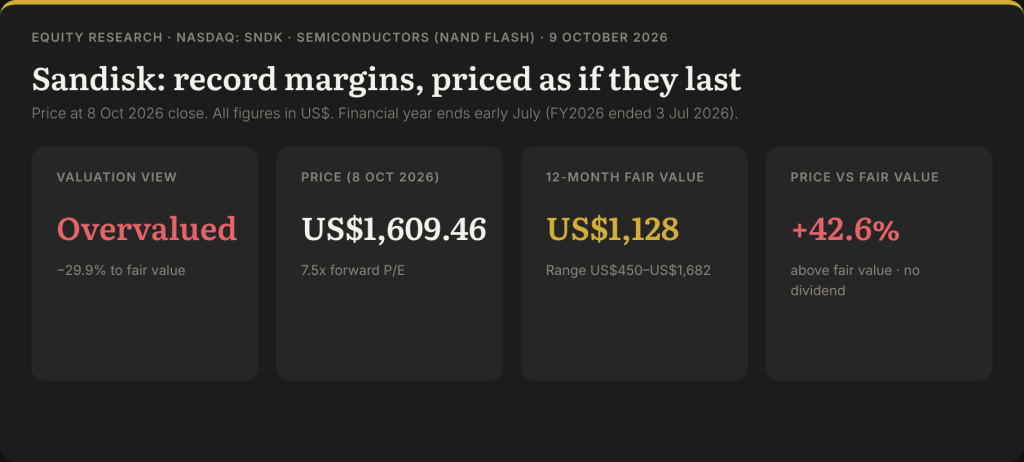
| Valuation view | Overvalued (−29.9% to fair value) |
| Current price | US$1,609.46 (8 Oct 2026 close; 7.5x forward P/E) |
| 12-month fair value | US$1,128 (50% DCF / 50% peers) |
| Bear–bull range | US$450 (−72.0%) to US$1,682 (+4.5%) |
| Dividend yield | None |
Key Takeaways
- Overvalued: our 12-month fair value is US$1,128 per share, −29.9% versus the US$1,609.46 close on 8 Oct 2026; even the bull case (US$1,682) is only +4.5% above the price.
- Priced for peak margins to last: at our 13.9% cost of capital the share price needs operating margins of about 60% to hold through FY2029–31; we fade them from 78% to 40% as NAND supply catches up. The price implies a 9.7% discount rate on our base cash flows.
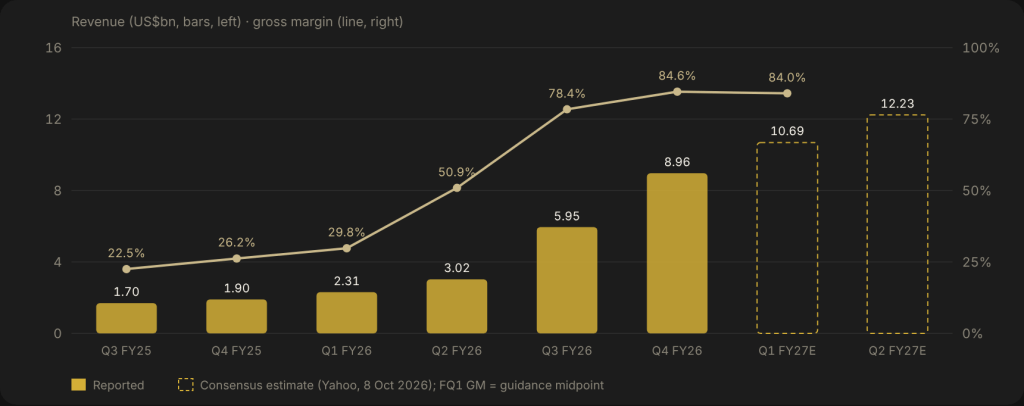
- The earnings are real: FY2026 revenue was US$20.25bn (+175%), fourth-quarter gross margin was 84.6%, and guidance for the quarter to September is US$10.3–10.8bn; results land on 29 Oct 2026.
The Verdict
Overvalued — fair value US$1,128 (range US$450–US$1,682), −29.9% vs US$1,609.46 (8 Oct 2026 close).
What is working: NAND contract prices have risen sharply through 2025–26 (TrendForce forecast +10–15% for 3Q26 and +15–20% for 4Q26), so Sandisk went from a loss in FY2025 to US$11.4bn of net income in FY2026, paid off all long-term debt and launched a US$20bn buyback (Q4 FY26 release). The shares are up +578.0% this year and sit −31.6% below the 52-week high of US$2,354.39. What the price already assumes: our base case already uses consensus revenue of US$49.0bn for FY2027 and US$57.8bn for FY2028 at about 78% operating margins, yet it still gives US$1,229 in the DCF. To reach US$1,609 you need those margins to stay near 60% for three more years after that. The deciding factor is how long NAND contract prices stay this high once new 2027–28 capacity arrives — TrendForce still sees +15–20% in 4Q26, but the first weekly fall in wafer prices in months (−2.9%) showed up this week (TrendForce; TechTimes).
Recent Developments (Last 12 Months)
| Date | Event | Why it matters |
|---|---|---|
| 6 Nov 2025 | FQ1 FY26: revenue US$2.31bn, non-GAAP GM 29.9% | Start of the price up-cycle |
| 24 Nov 2025 | S&P DJI: SNDK joins S&P 500 (effective 28 Nov), replacing IPG (S&P DJI) | Index demand; confirms index status |
| 29 Jan 2026 | Kioxia JV extended to 31 Dec 2034; Sandisk pays Kioxia US$1.165bn over 2026–29 (Kioxia) | Extends the JV five years, to 31 Dec 2034 |
| 18 Feb 2026 | Western Digital sells 5.82m SNDK shares at US$545 via debt-for-equity exchange (Yahoo) | Removes most of the spin-off overhang |
| 20 Apr 2026 | Joins the Nasdaq-100, replacing Atlassian (Tiger Brokers) | More passive ownership |
| 30 Apr 2026 | FQ3 FY26: revenue US$5.95bn, GM 78.4%; long-term debt repaid to zero | Balance sheet cleaned up |
| 25 Jun – 29 Jul 2026 | All-time closing high US$2,335.00, then a 56% fall to US$1,015.89 (TIKR) | Shows how violent the swings are |
| 5 Aug 2026 | FQ4 FY26: revenue US$8.97bn, GM 84.6%; FQ1 guide US$10.3–10.8bn; extra US$14bn buyback (release) | Peak-margin quarter; US$15.5bn buyback capacity left |
| 13 Aug 2026 | Investor Day: long-term model of mid-to-high-teens revenue growth and ~80% gross margin; contracts cover ~50% of FY27 bits (ts2.tech) | Management argues the cycle is structurally better |
| 14 & 17 Sep 2026 | CEO David Goeckeler sells 67,679 shares (~US$105m) (secform4) | Largest insider sale of the year; 10b5-1 status not confirmed |
| 21 Sep 2026 | Joins the S&P 100, replacing Colgate-Palmolive (Motley Fool) | Stock +11.0% on 18 Sep ahead of it |
| 5 Oct 2026 | Mizuho raises target to US$2,050 from US$1,875 (TheStreet) | Brokers remain bullish (25 analysts: 21 Buy/Strong Buy) |
| 8 Oct 2026 | Shares −4.9% to US$1,609.46 on AI build-out doubts (Crypto Briefing) | Sector-wide de-rating risk (MU −4.79%, stockanalysis) |
| 29 Oct 2026 | Next: FQ1 FY27 results, call 1:30pm PT (Sandisk) | First test of whether margins peaked |
Key Numbers
| Metric | Value | Note |
|---|---|---|
| Forward P/E | 7.5x | stockanalysis, 8 Oct 2026 |
| P/B | 16.0x | Book US$15.7bn; asset-light by this test |
| Revenue growth (FY2026) | +175.3% | US$7.36bn → US$20.25bn |
| Cost of equity (= WACC) | 13.9% | No debt; peer-median beta 2.08 |
| Gross margin, Q4 FY26 | 84.6% | From 26.2% a year earlier |
| Drawdown from 52-week high | −31.6% | 52-week range US$116.17–2,354.39 (IBKR) |
1. Business & Moat
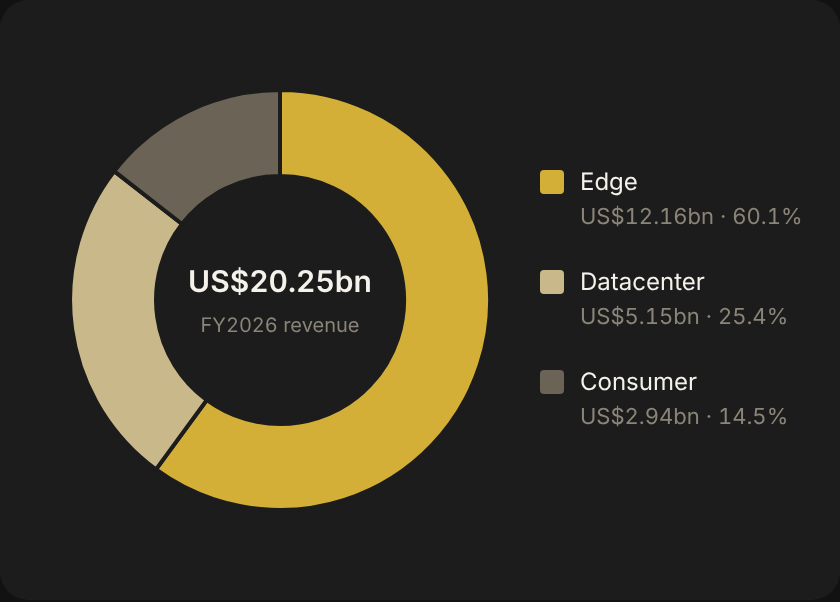
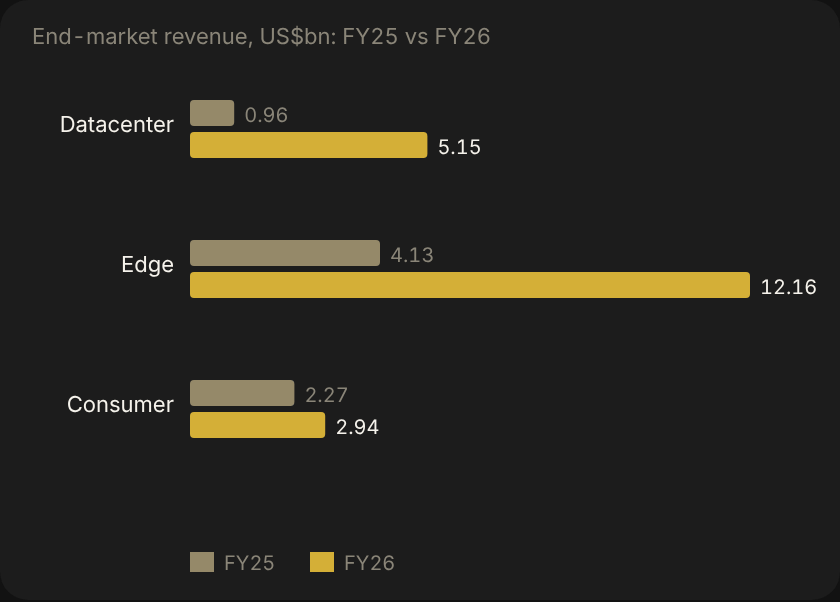
Sandisk designs and sells NAND flash memory — SSDs for data centres, flash for phones and PCs (“Edge”), and memory cards and USB drives (“Consumer”). It was spun out of Western Digital in February 2025. It does not own its fabs outright: it holds 49.9% of the Flash Ventures joint ventures with Kioxia, which run eight fabs in Japan; each partner generally buys half the output at cost plus a small markup (10-K). No customer exceeded 10% of revenue in FY2026; the top ten were 44%. International sales were 82% of revenue; a detailed regional split was NOT FOUND.
| End market | Q4 FY26 (US$m) | FY26 (US$m) | FY26 growth |
|---|---|---|---|
| Datacenter | 2,977 | 5,153 | +437% |
| Edge | 5,432 | 12,160 | +195% |
| Consumer | 556 | 2,935 | +29% |
| Total | 8,965 | 20,248 | +175% |
Guidance for FQ1 FY27 (quarter to about late September): revenue US$10.3–10.8bn, non-GAAP gross margin 83–85%, non-GAAP EPS US$44–46 on about 155m diluted shares (release).
Porter’s Five Forces
| Force | Pressure | Why |
|---|---|---|
| Rivalry | High | A handful of large NAND makers (Samsung, SK hynix, Kioxia/Sandisk, Micron, YMTC) — prices swing with capacity |
| Buyer power | Medium–high | Top ten customers 44% of sales; hyperscalers negotiate multi-year bit contracts |
| Supplier power | Medium | Tied to Kioxia JV to 2034; equipment makers concentrated |
| Threat of substitutes | Low–medium | HDDs still cheaper per terabyte for cold storage |
| Threat of entry | Low | Very capital-intensive fabs and process know-how |
Moat verdict: narrow. Scale, the Kioxia cost base and long-term supply contracts help, but the product is a commodity and pricing, not loyalty, drives margins.
2. Leadership & Capital Allocation
| Item | Detail |
|---|---|
| Chairman & CEO | David Goeckeler (Sandisk) |
| EVP & CFO | Luis Visoso |
| Control | No controlling holder; largest 13F holders BlackRock (10.3m shares) and Vanguard Capital Management (9.7m; about 13.2m across all Vanguard entities), 30 Jun 2026 (InsiderSet). Insiders own about 0.21%. |
| Pay | CEO pay from the proxy: NOT FOUND |
| Returns | ROE about 73% in FY2026 (net income US$11.43bn / year-end equity US$15.74bn) vs our 13.9% hurdle |
| Buybacks | US$6bn (Apr 2026) + US$14bn (Aug 2026) authorised; US$4.52bn bought in Q4; US$15.5bn left |
| Dividend | None |
| Debt | US$1.9bn repaid in FY2026; long-term debt zero; cash US$4.76bn (3 Jul 2026) |
| Dilution | Stock-based pay US$232m in FY2026; 146.42m shares outstanding on 7 Aug 2026 |
| M&A | None found |
Insider check: net selling — no open-market purchases in 12 months; nine sales of 77,899 shares (about US$121m) in the last 90 days, led by CEO David Goeckeler selling 67,679 shares for about US$105m on 14 and 17 Sep 2026 at US$1,528–1,574; MarketBeat puts 12-month insider selling at US$133.8m by 7 insiders (secform4; MarketBeat).
3. Financial Health
| US$m (FY ends ~1 Jul) | FY22 | FY23 | FY24 | FY25 | FY26 |
|---|---|---|---|---|---|
| Revenue | 9,754 | 6,086 | 6,663 | 7,355 | 20,248 |
| Gross margin | 33.3% | 7.1% | 16.1% | 30.1% | 71.5% |
| Operating income | 1,216 | −1,295 | −444 | 507 | 12,468 |
| Net income | 1,064 | −2,143 | −672 | −1,641 | 11,433 |
| Diluted EPS (US$) | n/a | −14.78 | −4.63 | −11.32 | 73.76 |
| Free cash flow | 741 | −932 | −475 | −120 | 11,494 |
Latest quarter (Q4 FY26, to 3 Jul 2026): revenue US$8,965m, gross margin 84.6%, GAAP EPS US$43.97 (non-GAAP US$39.25). Cash US$4,762m, total debt US$201m (leases), equity US$15,736m (stockanalysis; release). FY22–FY24 are carve-out figures from before the spin-off.
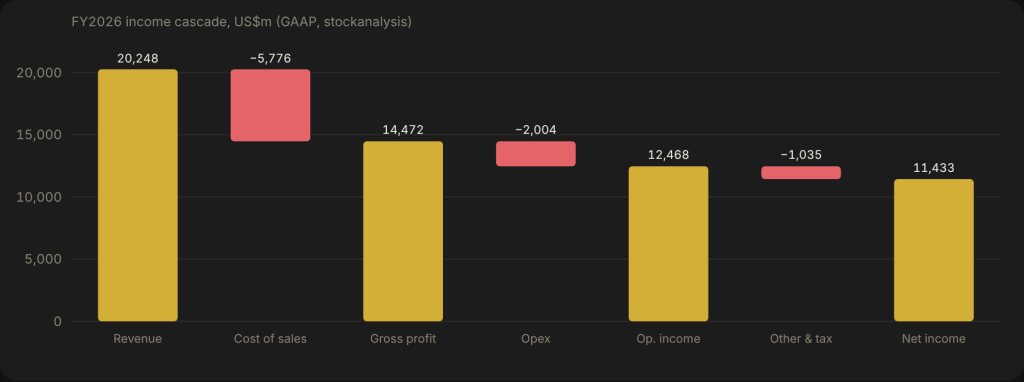
- Cash backs the profit: FY2026 operating cash flow US$11.67bn vs net income US$11.43bn; capex only US$177m because fab investment sits in the Kioxia JVs.
- Company-defined FCF is lower: Sandisk’s own adjusted FCF was US$8.74bn for FY2026, which counts JV-related spending the cash-flow statement does not.
- Margins are cyclical, not structural (yet): gross margin went 22.5% → 84.6% in five quarters, mostly from price; about two-thirds of Q4’s growth came from pricing (ts2.tech analysis).
- Two operating-income figures: US$12,389m in the release vs US$12,468m at stockanalysis — a classification difference; neither changes the valuation.
4. Risks
Macro & Regulatory
- Serious: AI-capex slowdown — the 8 Oct sell-off was about doubts on the pace of AI build-outs; data-centre SSDs are now a quarter of sales.
- Watch: rates — the US 10-year yield is 5.27% (FRED/Alpha Vantage); the stock fell 9.0% on 18 Aug when yields rose.
- Watch: export controls and Japan–China trade policy affecting fabs in Japan and sales in Asia (82% of revenue international).
Operational & Competitive
- Critical: NAND oversupply — new capacity from Samsung, SK hynix, Micron and YMTC in 2027–28 could reverse prices; our base case cuts FY2029 revenue 15%.
- Serious: JV dependence — output depends on Kioxia’s fabs and joint decisions on capex.
- Watch: HBF (high-bandwidth flash) is promising but no sampling date has been disclosed by the company.
Financial & Governance
- Serious: volatility — the shares fell 56% between 25 Jun and 29 Jul 2026; a beta near 2 means big swings either way.
- Watch: heavy insider selling (about US$121m in 90 days) while the company buys back stock.
- Watch: buybacks at peak prices could destroy value if the cycle turns.
5. Catalysts
| When | Measurable test | Odds |
|---|---|---|
| Late Oct 2026 (date TBC) | SK hynix results: NAND pricing commentary stays positive | 60% |
| 29 Oct 2026 | FQ1 FY27 revenue ≥ US$10.55bn (guide midpoint) and GM ≥ 84% | 60–70% |
| 29 Oct 2026 | FQ2 FY27 revenue guide midpoint ≥ US$12.2bn (consensus US$12.23bn) | 50% |
| Late Dec 2026 | TrendForce 1Q27 NAND contract-price forecast still positive | 55% |
| 2027 | HBF samples to customers | NOT FOUND (no company date) |
Bull case vs consensus: consensus (18–20 analysts, Yahoo) has FY2027 revenue US$48.96bn / EPS US$214.10 and FY2028 US$57.79bn / US$264.72, with FY2028 EPS up from US$198.30 sixty days ago (Yahoo). The average target is US$2,173 (range US$1,000–3,600; stockanalysis). Our bull case uses FY2028 revenue of US$66bn and still gives US$1,682 because we discount a cyclical fade after FY2028.
6. Valuation Suite
6a. Cost of Capital
| Input | Value | Source / note |
|---|---|---|
| Risk-free (with date) | 5.27% (6 Oct 2026) | US 10-year Treasury, Alpha Vantage / FRED DGS10 |
| Own 2-yr weekly beta vs S&P 500 | n/a | Only 87 weekly bars since the Feb 2025 listing (rule: under 2 years → peer median) |
| Peer median beta (check) | 2.08 | stockanalysis 5Y betas: MU 2.23, WDC 2.17, STX 2.08, P 1.40, NTAP 1.45, SK hynix 2.39, Samsung 1.55 |
| Raw beta used | 2.08 | Peer median |
| Adjusted beta (0.67×raw+0.33) | 1.72 | |
| Equity risk premium | 5.0% | Developed market |
| Size/illiquidity premium | 0.0% | Mega-cap, US$11bn/day traded |
| Cost of equity | 13.9% | |
| Debt weight / after-tax cost of debt | ~0% / n/a | No long-term debt; US$201m leases |
| WACC | 13.9% | Same rate used in DCF, residual income and peer discounting |
6b. Discounted Cash Flow (DCF)
| US$bn | FY27E | FY28E | FY29E | FY30E | FY31E |
|---|---|---|---|---|---|
| Revenue | 49.0 | 57.8 | 49.1 | 50.6 | 52.1 |
| Growth | +141.8% | +18.0% | −15.0% | +3.0% | +3.0% |
| EBIT margin | 78% | 78% | 55% | 45% | 40% |
| EBIT | 38.2 | 45.1 | 27.0 | 22.8 | 20.8 |
| NOPAT (15% tax) | 32.5 | 38.3 | 23.0 | 19.4 | 17.7 |
| Reinvestment | 5.8 | 3.1 | 0.2 | 1.7 | 1.8 |
| FCFF | 26.7 | 35.3 | 22.8 | 17.6 | 15.9 |
Assumptions: FY2027 and FY2028 revenue are consensus (Yahoo); the FQ1 guide of US$10.3–10.8bn annualises to about US$42bn, so FY2027 needs further growth. EBIT margin 78% in FY2027–28 (FQ1 guide implies about 78%), then a fade to 55%, 45% and 40% as new industry capacity arrives. Tax 15% (company non-GAAP rate). Reinvestment = 3% of revenue + 15% of the revenue change (covers JV funding and working capital). Cash flows discounted from 0.75 years (FY2027 ends early July 2027) at 13.9%. Net cash US$4.56bn; 146.42m shares.
| Case | Key differences | Perpetuity (g) | Exit multiple | DCF value |
|---|---|---|---|---|
| Bear | FY27 US$42.2bn (guide run-rate), FY28 US$38bn, FY29 −30%; EBIT margin falls to 25% | US$467 (g 2%) | US$477 (6x) | US$472 |
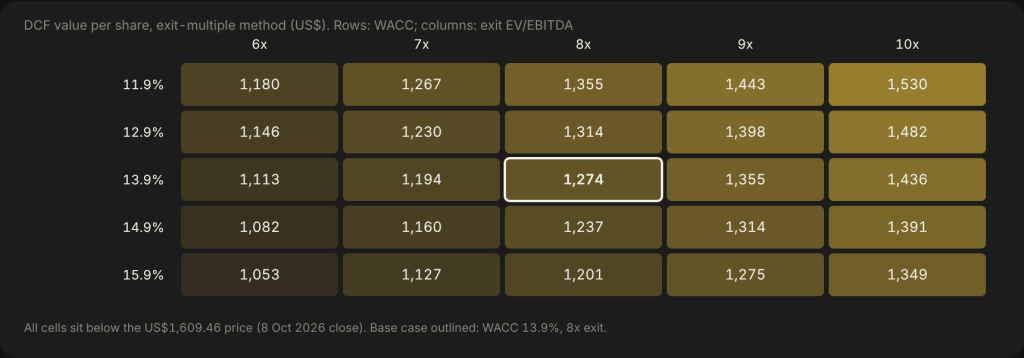
| Base | Consensus FY27–28; FY29 −15%; margin fades 78% → 40% | US$1,184 (g 3%) | US$1,274 (8x) | US$1,229 |
| Bull | FY27 US$52bn, FY28 US$66bn, FY29 −5%; margin holds 55%+ | US$1,979 (g 3.5%) | US$2,370 (10x) | US$2,175 |
Implied discount rate: 9.7% vs our 13.9% WACC — the price only works on our base cash flows if investors accept a return about 4 points below our hurdle for a beta-2 stock.
6c. Residual Income
| US$ per share | FY27E | FY28E | FY29E | FY30E | FY31E |
|---|---|---|---|---|---|
| Opening book | 107 | 218 | 349 | 428 | 494 |
| EPS (model) | 222 | 262 | 157 | 132 | 121 |
| ROE | 206% | 120% | 45% | 31% | 25% |
| Residual income | 207 | 231 | 108 | 73 | 52 |
Book value US$107.47 per share (US$15.74bn / 146.42m shares); half of earnings retained (rest bought back). Value with full persistence US$896, with 50% persistence US$650 (average US$773). Justified P/B on a normalised 25% ROE is 2.0x vs about 16x today. Shown for reference only (0% weight) — asset-light by our rule, P/B above 10x.
6d. Peers (stockanalysis, prices at 8 Oct 2026)
| Ticker | Price | Mkt cap | Fwd P/E | EV/EBITDA | 3-yr growth fcst |
|---|---|---|---|---|---|
| SNDK | US$1,609.46 | US$235.7bn | 7.49 | 18.09 | +41.0% |
| MU | US$1,035.84 | US$1.17tn | 6.18 | 10.44 | +33.6% |
| Kioxia (285A)* | ¥55,780 | ¥30.57tn | 4.28 | 12.74 | +87.4% |
| SK hynix (000660)* | ₩1,841,000 | ₩1,341.8tn | 4.49 | 9.14 | +83.2% |
| Samsung (005930) | ₩265,000 | ₩1,684.6tn | 4.35 | 6.81 | +47.0% |
| WDC | US$393.31 | US$147.2bn | 19.49 | 29.36 | +34.8% |
| STX | US$774.83 | US$176.2bn | 22.47 | 39.61 | +36.7% |
| NTAP | US$230.51 | US$45.3bn | 23.73 | 21.40 | +9.9% |
| P (Pure Storage) | US$150.57 | US$50.2bn | 46.18 | 128.59 | +31.9% |
Peer method: median forward P/E of the four memory producers that sell the same commodity (MU, Kioxia, SK hynix, Samsung) = 4.42x, applied to consensus FY2028 EPS of US$264.72, discounted one year at 13.9% = US$1,027. Disk-drive and storage-system peers (WDC, STX, NTAP, P) are shown but excluded because their earnings are not driven by NAND prices; including all eight gives a 12.8x median (see 6e). Cross-check: SNDK on the memory-peer trailing EV/EBITDA median (9.8x) = US$879. *Kioxia quote is from 25 Sep and SK hynix from 2 Oct (stale on stockanalysis).
6e. Single-lever Test
| Input changed alone | Low | High | Swing |
|---|---|---|---|
| Peer P/E (Kioxia 4.28x low; all-peer median 12.8x high) | US$1,112 | US$2,106 | US$994 |
| Long-run EBIT margin FY30–31 (35/30% vs 45/40%; 55/50%) | US$1,034 | US$1,223 | US$188 |
| FY29 revenue change (−30% / 0%) | US$1,058 | US$1,199 | US$141 |
| Exit EV/EBITDA (6x / 10x) | US$1,088 | US$1,169 | US$81 |
| WACC ±1pt (14.9% / 12.9%) | US$1,095 | US$1,166 | US$71 |
| Terminal growth (2% / 4%) | US$1,116 | US$1,144 | US$28 |
The biggest lever is the peer multiple: using all eight peers instead of the four memory producers moves fair value from US$1,112 to US$2,106.
7. Synthesis
| Method | Inputs | Value | vs price | Weight | Weighted |
|---|---|---|---|---|---|
| DCF | FCFF at 13.9%; average of perpetuity (US$1,184) and 8x exit (US$1,274) | US$1,229 | −23.6% | 50% | US$615 |
| Residual income | Book US$107; full/50% persistence US$896/US$650 | US$773 | −52.0% | 0% | US$0 |
| Peers | 4.42x × FY28E EPS US$264.72, discounted 1 yr | US$1,027 | −36.2% | 50% | US$514 |
| Fair value | US$1,128 | −29.9% | 100% | US$1,128 | |
| Bear / Base / Bull | Same weights per case | US$450 / US$1,128 / US$1,682 | −72.0% / −29.9% / +4.5% |
How much rests on consensus: if FY2028 follows our bear revenue path (EPS about US$110 instead of US$264.72), the peer value falls to US$428 and fair value to US$829 (−48.5%).
Margin of safety: the price is +42.6% above fair value (fair value is 29.9% below the price); the 30%-discount price is US$790; the implied discount rate is 9.7% vs our 13.9% WACC.
8. Technicals
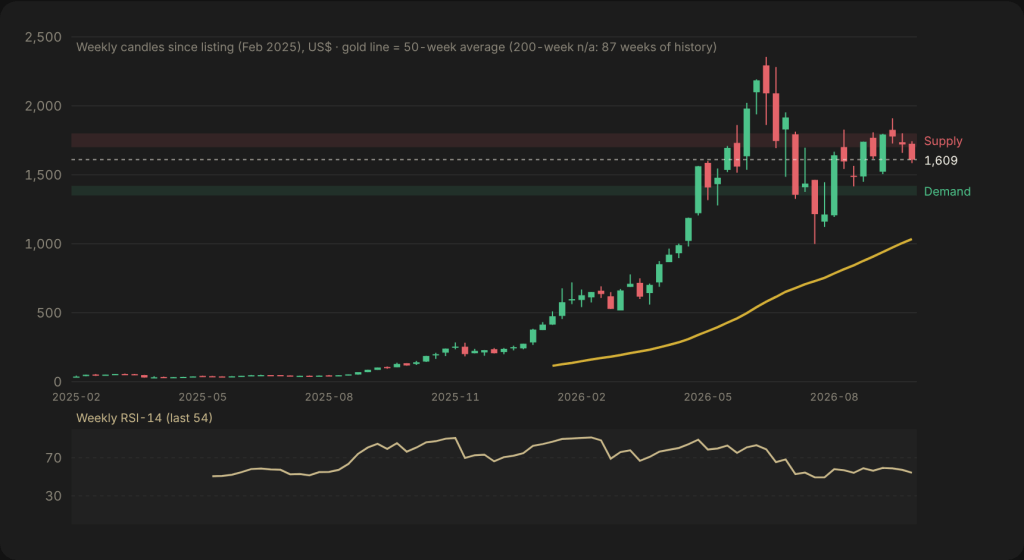
Trend: up over 12 months but broken short term — the price (US$1,609.46) is below the 100-day average (US$1,645) and just above the 50-day (US$1,576); the 200-day is US$1,175 and the 50-week US$1,033. The 50-day has stayed above the 200-day for as long as both can be measured.
Momentum: daily RSI-14 45, weekly 54 — neutral; the daily MACD histogram turned negative (−20.1 vs +0.2 a week ago).
Volatility: 20-day average true range US$94 (about 5.9% a day).
Volume: the heaviest 1-year trading (by value) sat around US$1,614, US$616, US$1,725 and US$1,392; the 63-session average is about 7.3m shares (about US$11.0bn a day) from IBKR daily bars.
| Level | Price | Basis |
|---|---|---|
| Resistance 2 | US$2,354 | 52-week and all-time intraday high (22 Jun 2026) |
| Resistance 1 | US$1,725–1,795 | Volume node and weekly pivot R1 |
| Current | US$1,609.46 | 8 Oct 2026 close |
| Support 1 | US$1,576–1,585 | 50-day average and weekly pivot S2 |
| Support 2 | US$1,392 | Volume node |
| Support 3 | US$1,175 | 200-day average |
Our Dated Calls
Six pre-registered calls, to be scored publicly on the dates shown (price calls on total return after typical trading costs).
| # | Call | Probability | Scoring date |
|---|---|---|---|
| 1 | FQ1 FY27 revenue ≥ US$10.55bn (guide midpoint) | 70% | 30 Oct 2026 |
| 2 | FQ1 FY27 non-GAAP gross margin ≥ 84.0% | 60% | 30 Oct 2026 |
| 3 | FQ2 FY27 revenue guidance midpoint ≥ US$12.2bn | 50% | 30 Oct 2026 |
| 4 | TrendForce’s first 1Q27 NAND contract-price forecast is positive QoQ | 55% | 15 Jan 2027 |
| 5 | SNDK total return from US$1,609.46 is negative after ~0.1% trading costs | 55% | 9 Apr 2027 |
| 6 | SNDK closes below US$1,200 at least once | 40% | 9 Apr 2027 |
Bull Case
- NAND stays tight into 2028: contracts already cover about 50% of FY27 and 67% of FY28 bits, and TrendForce sees +15–20% in 4Q26.
- Datacenter (+437% in FY26) and HBF could make margins structurally higher, as Investor Day argued (~80% long-term gross margin).
- US$15.5bn of buyback capacity — about 6.6% of the market value — supports the shares.
Bear Case
- At US$1,609 the shares need ~60% operating margins for years; every past NAND cycle has reversed.
- New capacity in 2027–28 and the first weekly wafer-price drop (−2.9%) hint the price peak is near.
- Insiders sold about US$121m in 90 days; a beta near 2 amplifies any AI-capex scare.
FAQ
What is Sandisk’s fair value?
Our 12-month fair value is US$1,128 per share (range US$450–US$1,682), from 50% DCF (US$1,229) and 50% peers (US$1,027); residual income (US$773) is shown for reference only.
Is Sandisk undervalued?
No. At US$1,609.46 (8 Oct 2026 close) we see it as overvalued, −29.9% to fair value, because the price assumes near-peak margins last through FY2031.
What are the main risks for Sandisk?
A NAND price reversal when new 2027–28 capacity arrives, a slowdown in AI data-centre spending, and very high volatility (a 56% fall in five weeks this summer).
When are Sandisk’s next results?
Fiscal Q1 2027 results are due on Thursday 29 Oct 2026, with a call at 1:30pm PT; guidance is US$10.3–10.8bn of revenue.
Does Sandisk pay a dividend?
No. It returns cash through buybacks: US$4.52bn in the last quarter, with US$15.5bn of authorisation left.
Method and Sources
Fair value blends a five-year unlevered DCF (average of perpetuity-growth and exit EV/EBITDA terminal values) with a memory-peer P/E on FY2028 consensus EPS, 50/50, because Sandisk is asset-light by our rule (P/B above 10x) — residual income is calculated but given no weight. One discount rate (13.9%, CAPM with peer-median beta 2.08 and a 5.27% 10-year Treasury) is used throughout. Prices from IBKR (8 Oct 2026 close); where articles and IBKR or filings disagree, the live source is used (e.g. one article’s US$1,023.88 ‘premarket’ SNDK quote was a Micron price and was ignored; the IBKR 90-day dollar-volume figure of US$20.8bn did not match the US$11.0bn we compute from IBKR daily bars, so the latter is used). Figures independently fact-checked against the linked sources on 9 Oct 2026.
- IBKR market data, contract 760250490 (SANDISK CORP, NASDAQ), daily/weekly bars to 8 Oct 2026
- stockanalysis — SNDK statistics (8 Oct 2026)
- Sandisk Q4 FY2026 results release (8-K Ex 99.1, 5 Aug 2026)
- Sandisk FY2026 Form 10-K
- stockanalysis — SNDK financials (annual & quarterly)
- stockanalysis — SNDK cash flow
- stockanalysis — SNDK balance sheet
- stockanalysis — SNDK forecast (updated 6 Oct 2026)
- Yahoo Finance — SNDK analysis (consensus)
- stockanalysis — SNDK analyst ratings
- secform4 — Sandisk insider filings
- MarketBeat — SNDK insider trades
- S&P DJI — Sandisk set to join S&P 500 (24 Nov 2025)
- Motley Fool — Why Sandisk stock rallied (18 Sep 2026, S&P 100)
- Kioxia — JV extension (30 Jan 2026)
- Yahoo Finance — WDC sells SNDK shares (18 Feb 2026)
- Sandisk — FQ1 FY2027 results date (29 Sep 2026)
- TrendForce — 3Q26 NAND forecast (3 Jul 2026)
- TrendForce — 4Q26 memory forecast (30 Sep 2026)
- TechTimes — memory stocks slip, NAND wafer prices (7 Oct 2026)
- TheStreet — Mizuho resets SNDK target to $2,050 (Oct 2026)
- Crypto Briefing — Sandisk drops on AI storage jitters (8 Oct 2026)
- ts2.tech — Investor Day long-term model and broker notes (Aug 2026)
- TIKR — Sandisk fell 55% from June high, then +26% (Jul 2026)
- Sandisk — management team
- Alpha Vantage TREASURY_YIELD (US 10-year constant maturity, 6 Oct 2026); series: FRED DGS10
- stockanalysis — MU statistics
- stockanalysis — WDC statistics
- stockanalysis — STX statistics
- stockanalysis — Pure Storage (shown as Everpure, P) statistics
- stockanalysis — NTAP statistics
- stockanalysis — Kioxia (TYO:285A) statistics
- stockanalysis — SK hynix (KRX:000660) statistics
- stockanalysis — Samsung Electronics (KRX:005930) statistics
- Tiger Brokers — Sandisk to join Nasdaq-100 (Apr 2026)
- InsiderSet — SNDK institutional ownership (30 Jun 2026)
- stockanalysis — SNDK price history
- TradingView — US most active by price × volume
Not located: own 2-year beta (history under 2 years); CEO pay (proxy not reviewed); named key customers; detailed geographic revenue split; FY2028 consensus from a second source; cause of the 4 Aug and 24 Aug 2026 moves; HBF sampling date; 10b5-1 status of every insider sale.
Analysis only, not a recommendation to buy or sell any security. Figures as at 8 Oct 2026; sources linked. The author does not hold a position in SNDK.
Get the next report by email
One institutional-style equity research report each weekday on Singapore and US stocks — free, straight to your inbox.


Leave a comment