
Download the full report (PDF)
Snapshot
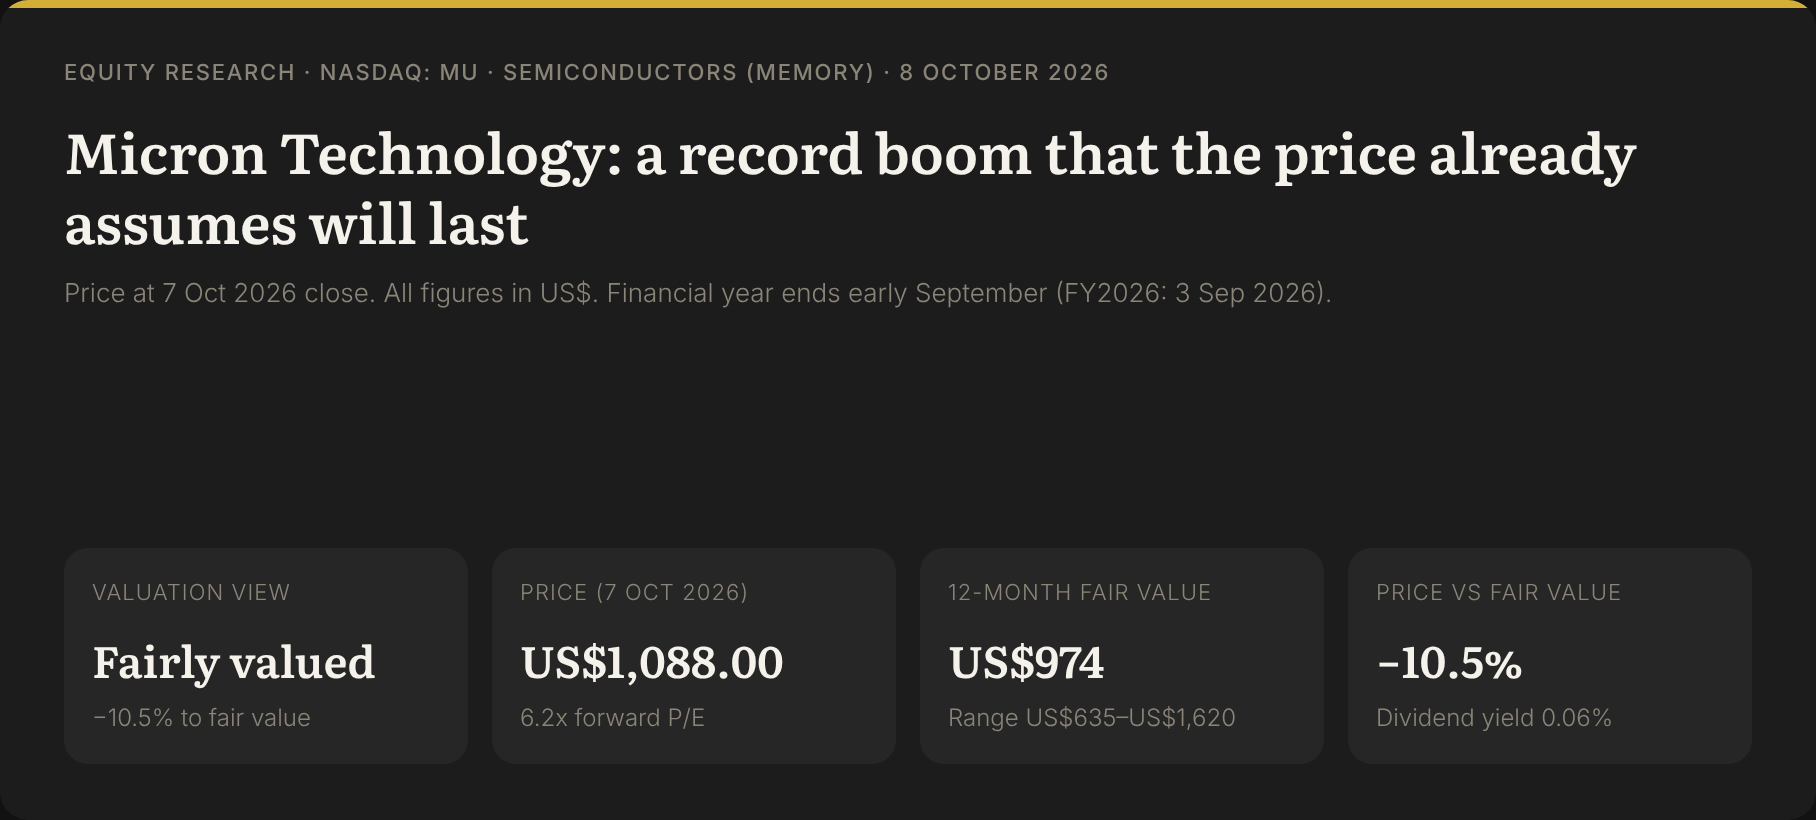
| Item | Value |
|---|---|
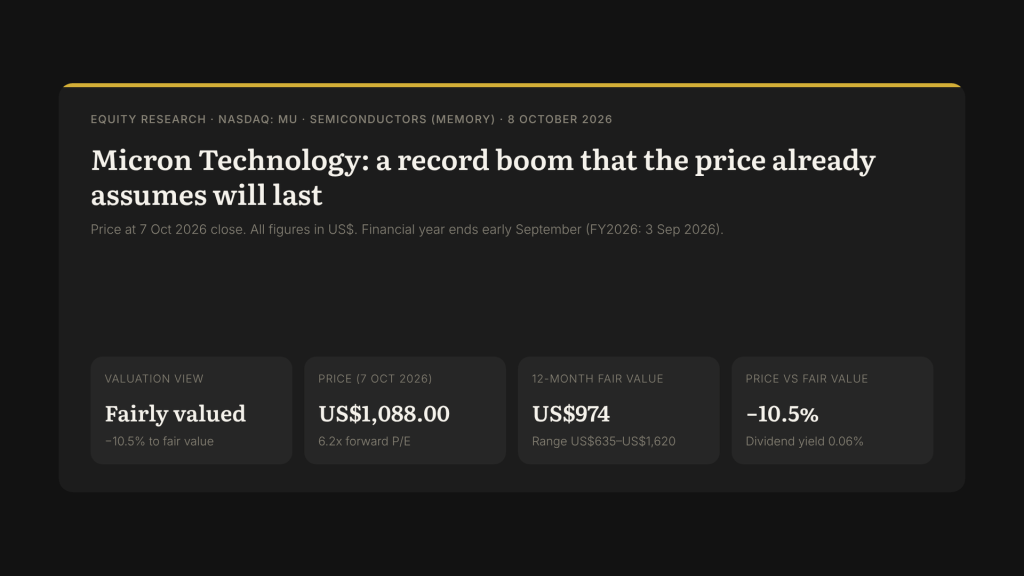
| Valuation View | Fairly valued (−10.5% to fair value) |
| Current Price | US$1,088.00 (7 Oct 2026 close; 6.2x forward P/E) |
| 12-month Fair Value | US$974 (40% DCF / 30% residual income / 30% peers) |
| Bear–bull Range | US$635 (−41.6%) to US$1,620 (+48.9%) |
| Dividend Yield | 0.06% (US$0.15 a quarter) |
Key Takeaways
- Fairly valued: our fair value is US$974 vs US$1,088.00 (−10.5%), with a range of US$635–US$1,620; the shares trade on 6.2x forward earnings because the market is treating FY2027 as close to a cyclical peak (stockanalysis).
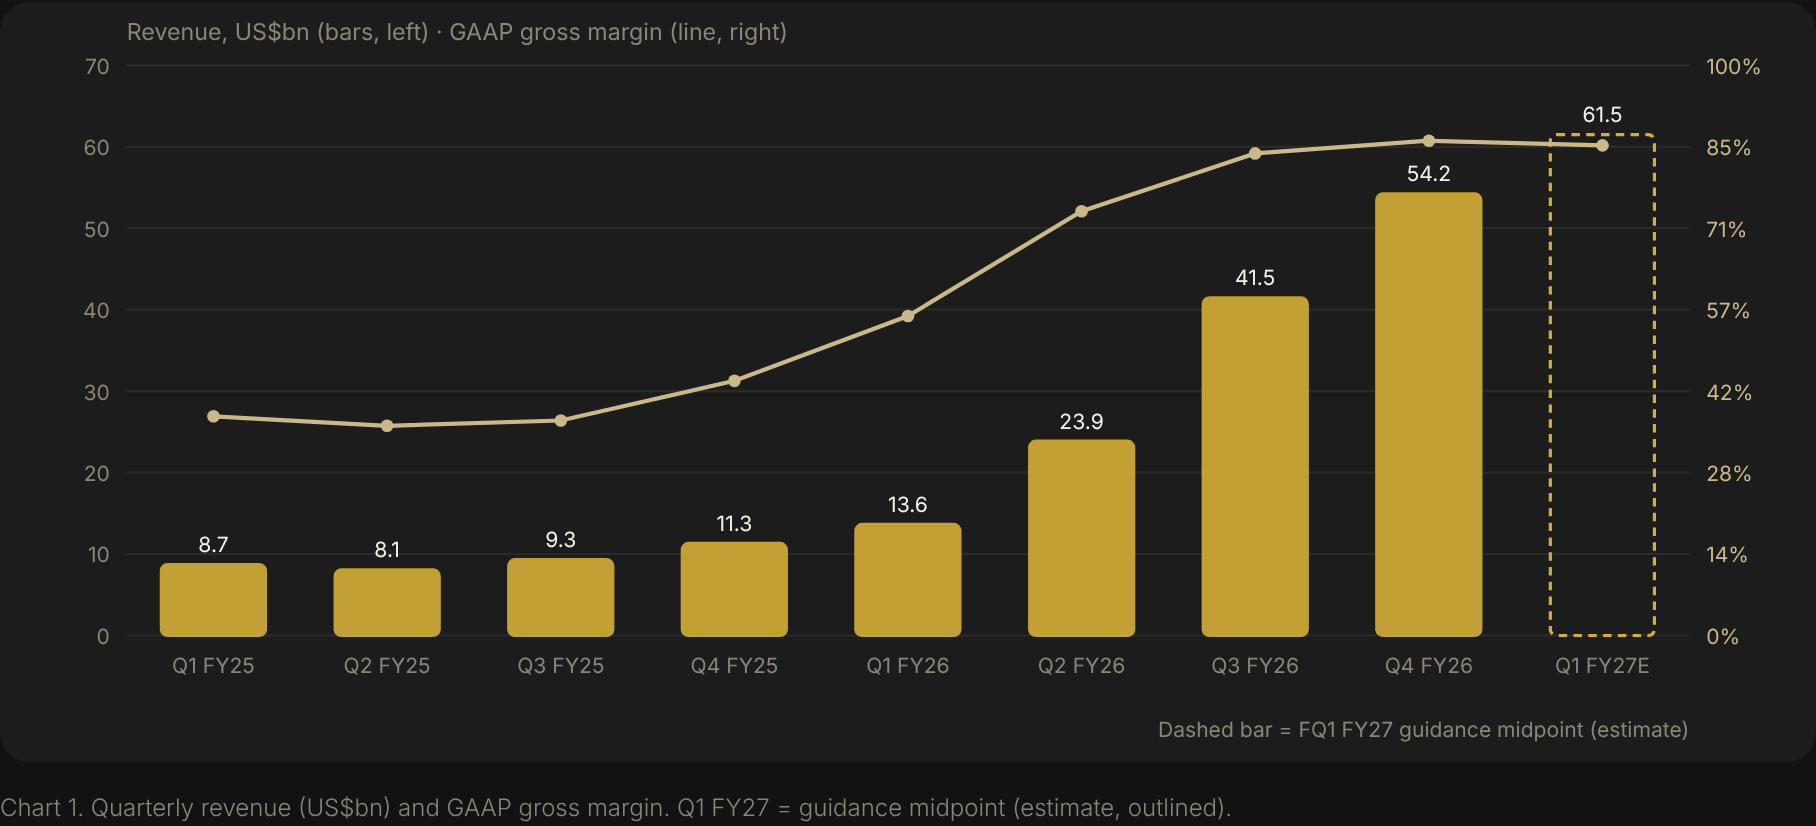
- A record quarter, and a bigger one guided: FQ4 FY2026 revenue was US$54.23bn (+379.3% year on year) at an 87.0% non-GAAP gross margin, and FQ1 FY2027 is guided to US$61.5bn ± US$1.5bn (FQ4 FY2026 release).
- The price assumes the boom lasts: our base-case cash flows, with revenue falling to US$200bn in FY2029, equal today’s price only at an 8.4% discount rate vs our 14.5% WACC; the P/E applied to mid-cycle earnings is the biggest lever (US$808–US$1,089).
The Verdict
Fairly valued — fair value US$974 (range US$635–US$1,620), −10.5% vs US$1,088.00 (7 Oct 2026 close).
What is working: Micron is in the strongest memory upcycle in its history. FY2026 (year to 3 Sep 2026) revenue rose to US$133.19bn from US$37.38bn and GAAP net income to US$84.97bn, with GAAP diluted EPS of US$74.33 (FQ4 FY2026 release, stockanalysis). On the FQ4 call management said DRAM prices rose by a high-teens percentage quarter on quarter and NAND prices by about 30%, that 26 multi-year take-or-pay customer agreements cover more than 35% of revenue through 2030, and that it holds about US$150bn of remaining performance obligations (call transcript, MarketBeat call summary). Net cash was US$68.3bn at 3 Sep 2026.
What the price already assumes: the shares are up 281.2% this year (from US$285.41 at 31 Dec 2025) and 13.3% below the 52-week high of US$1,255.00 (week of 22 Jun 2026; IBKR). At US$1,088.00 they trade on 6.2x FY2027 consensus EPS of US$176.15 (stockanalysis consensus). Our base case uses consensus FY2027 revenue of US$275.0bn, then lets revenue fall 9% in FY2028 and 20% in FY2029 as new industry capacity arrives, with the EBITDA margin settling at 55%. Those cash flows equal today’s price only at an 8.4% discount rate, against our 14.5% WACC — so the price already assumes earnings stay well above our mid-cycle path.
The single factor that decides it: whether DRAM and NAND prices hold once the industry’s 2027–28 capacity additions arrive. Our base case has EPS falling from about US$171 in FY2027 to about US$75 in FY2029–31; if the take-or-pay agreements keep it at roughly US$145–160 (bull case), fair value is US$1,620; a repeat of past memory downturns — the shares fell about 70% in 2014–16, 57% in 2018–19 and about 50% in 2022–23 (Trefis) — points to the bear case (US$635).
Recent Developments (Last 12 Months)
| Date | Event | Why it matters |
|---|---|---|
| 19 Oct 2025 | Reuters report: Micron to exit server-chip sales to China data centres; China was about US$3.4bn, ~12% of FY2025 revenue (The Standard) | Smaller China exposure |
| 17 Dec 2025 | FQ1 FY2026: revenue US$13.64bn, non-GAAP EPS US$4.78; dividend US$0.115 (8-K) | Upcycle begins |
| 13 Jan 2026 | Director Teyin Liu buys 23,200 shares at US$337.14 (about US$7.8m) — the only open-market insider purchase in 12 months (Form 4 via secform4) | Insider buying |
| 17 Jan 2026 | Letter of intent to buy PSMC’s Tongluo fab site in Taiwan; completed 15 Mar 2026 (StockTitan) | Faster capacity (M&A) |
| 9 Mar 2026 | Added to the S&P 100, effective 23 Mar 2026 (stockti) | Index flows |
| 16 Mar 2026 | HBM4 for NVIDIA Vera Rubin in high-volume production (StockTitan) | HBM customer win |
| 18 Mar 2026 | FQ2 FY2026: revenue US$23.86bn; quarterly dividend raised 30% to US$0.15 (8-K) | Dividend increase |
| 22 Jun 2026 | Multi-year memory supply agreement with Anthropic plus a Micron investment in its Series H (amount not disclosed) (FourWeekMBA) | AI customer |
| 24 Jun 2026 | FQ3 FY2026: revenue US$41.46bn; 2026 HBM sold out (ValueTheMarkets, AI Weekly) | Beat and raise |
| 9 Jul 2026 | Up to US$3bn US supply-chain investment incl. US$500m financing for GlobalWafers’ Texas wafer plant; US investment plan raised to more than US$250bn through 2035 (Tom’s Hardware) | Capex and supply security |
| 24 Jul & 21 Aug 2026 | CEO Sanjay Mehrotra sells 40,000 shares on each date (about US$76.1m in total) (Form 4 via secform4) | Insider selling |
| 26 Aug 2026 | Manish Bhatia named President & COO, Scott DeBoer President & Chief Technology and Products Officer; Sumit Sadana becomes Senior Advisor (company release via Finviz) | Management change |
| 30 Sep 2026 | FQ4 FY2026: revenue US$54.23bn, non-GAAP EPS US$33.42; FQ1 FY2027 guide US$61.5bn ± US$1.5bn; dividend US$0.15 declared (8-K) | Record quarter |
| 30 Sep–1 Oct 2026 | Capex guided to about US$25bn in 1H FY2027, higher in 2H; shares fell after hours (Stocktwits) | Main bear trigger |
| 1–7 Oct 2026 | Broker targets raised: DA Davidson to US$3,000 (7 Oct), Rosenblatt to US$1,900 and Mizuho to US$1,400 (1 Oct) (MarketBeat) | Sentiment |
| 14 Oct 2026 (next) | Dividend record date (US$0.15), payable 29 Oct 2026 (8-K); FQ1 FY2027 results date not yet announced | Next scheduled events |
Key Numbers
| Metric | Value | Basis |
|---|---|---|
| Forward P/E | 6.2x | US$1,088.00 ÷ FY2027 consensus EPS US$176.15 (stockanalysis) |
| P/B | 8.9x | stockanalysis, 7 Oct 2026 |
| Revenue growth | +379.3% / +256.3% | FQ4 FY2026 y/y / FY2026 y/y |
| Cost of equity / WACC | 14.6% / 14.5% | US 10-year 5.31% + adjusted β 1.85 × 5% |
| Non-GAAP gross margin | 87.0% | FQ4 FY2026 (FY2025 FQ4 GAAP: 44.7%) |
| From 52-week high | −13.3% | 52-week range US$179.61–US$1,255.00 (IBKR) |
1. Business & Moat
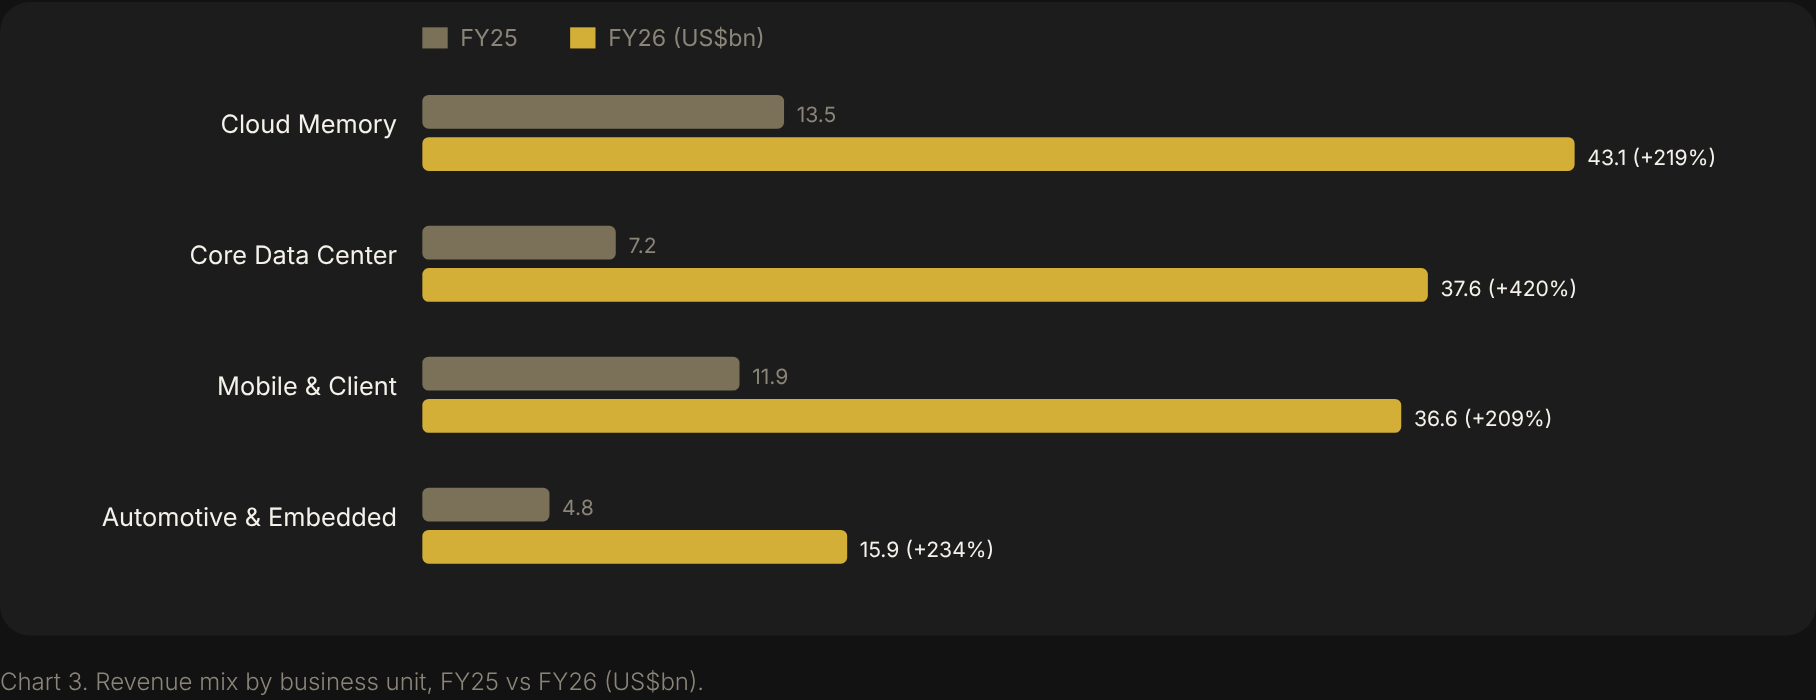
Micron Technology, Inc. (NASDAQ: MU; IBKR contract 9939 “MICRON TECHNOLOGY INC”) designs and manufactures DRAM — including high-bandwidth memory (HBM) for AI accelerators — and NAND flash. It is one of three large DRAM makers. Its fiscal year ends around the start of September; FY2026 ended on 3 Sep 2026 and was reported on 30 Sep 2026. In FQ4 DRAM was US$39.8bn (73% of revenue) and NAND US$14.1bn (26%); HBM revenue is not disclosed (call transcript, MarketBeat).
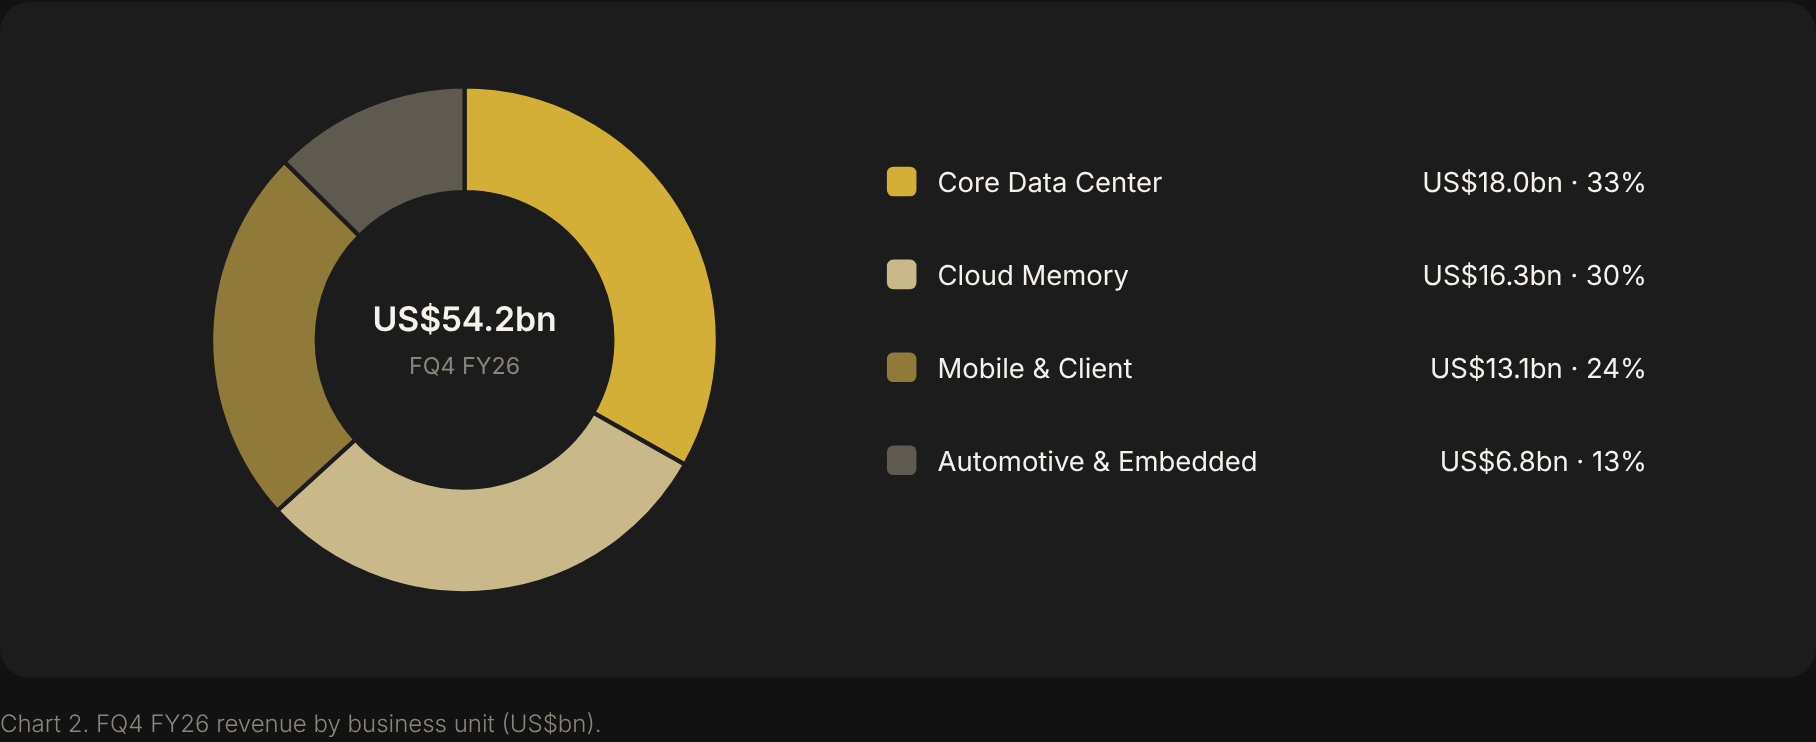
| Business unit | FQ4 FY26 (US$m) | Share | FY26 (US$m) | FY25 (US$m) | FY growth |
|---|---|---|---|---|---|
| Core Data Center (CDBU) | 18,002 | 33% | 37,592 | 7,229 | +420.0% |
| Cloud Memory (CMBU) | 16,283 | 30% | 43,085 | 13,524 | +218.6% |
| Mobile & Client (MCBU) | 13,114 | 24% | 36,601 | 11,859 | +208.6% |
| Automotive & Embedded (AEBU) | 6,824 | 13% | 15,886 | 4,753 | +234.2% |
| Total | 54,229 | 100% | 133,188 | 37,378 | +256.3% |
Sources: FQ4 from the 8-K release; full-year business-unit figures from stockanalysis (they sum to reported revenue; FY totals include about US$24m “other”). Customers: the top ten customers were about half of revenue in each of the last three fiscal years (FY2025 10-K). Customer deposits under the strategic agreements (non-current customer contract liabilities) were US$12.9bn on the balance sheet at 3 Sep 2026. Geography: the FY2025 10-K says about 80% of revenue shipped to locations outside the US; a FY2026 regional split is not yet available (10-K not filed). Guidance: FQ1 FY2027 revenue US$61.5bn ± US$1.5bn, GAAP gross margin about 85.95% (non-GAAP about 86.25%), non-GAAP EPS US$38.15 ± US$1.00 on about 1.15bn diluted shares; management called FQ1 “the floor for gross margins in fiscal 2027” (8-K, call).
Porter’s Five Forces
| Force | Pressure | Evidence |
|---|---|---|
| Rivalry | High (but disciplined now) | Three-way DRAM oligopoly; the three large makers are spending more than US$75bn a year on capex in this upcycle (Trefis) |
| Buyer power | High | Top ten customers ≈ half of revenue; hyperscalers and NVIDIA negotiate multi-year volumes and prices |
| Supplier power | Medium | Equipment and wafer suppliers; Micron financed GlobalWafers’ Texas plant (US$500m) to secure wafers |
| Threat of substitutes | Low | No substitute for DRAM/HBM in AI servers; “memory-saving” techniques are a demand risk, not a product substitute |
| Threat of new entrants | Low | New fabs cost billions — Micron’s Hiroshima HBM expansion alone is ¥1.5tn (about US$9.3bn) (The Next Web) |
Moat verdict: narrow — scale, process technology and HBM qualification in a three-player market, but little pricing power once supply catches up.
2. Leadership & Capital Allocation
| Item | Detail |
|---|---|
| Chairman, President & CEO | Sanjay Mehrotra (CEO since May 2017; Chairman since Jan 2025) (FY2025 10-K) |
| President & COO | Manish Bhatia (from 26 Aug 2026) |
| President & Chief Technology and Products Officer | Scott DeBoer (new role, 26 Aug 2026) |
| EVP & CFO | Mark J. Murphy |
| Control | No controlling holder; BlackRock 9.28%, Vanguard 7.1%, State Street 4.43%; insiders about 0.2% (Simply Wall St) |
| CEO pay | NOT FOUND in the primary proxy (latest DEF 14A, Nov 2025, not parsed) |
| Returns vs hurdle | ROE 88.3% and ROIC 93.4% (trailing, stockanalysis) vs our 14.6% cost of equity — peak-cycle returns |
| Dividends | US$0.15 a quarter after a 30% rise in Mar 2026; US$610m paid in FY2026; yield 0.06% |
| Buybacks | US$650m repurchased in FY2026 plus US$1,127m withheld for employee tax; US$2.2bn authorisation left; management plans to step up returns, mainly buybacks, from 9 Dec 2026 (call) |
| Debt | Total debt cut from US$15.35bn (FY2025) to US$5.18bn; net cash US$68.3bn |
| Dilution | Diluted weighted-average shares 1,141m in FY2021 vs 1,143m in FY2026 (FQ4: 1,147m) — flat over five years |
| M&A / investments | PSMC Tongluo fab site (completed 15 Mar 2026); US$500m GlobalWafers financing; investment in Anthropic’s Series H; US$250m Micron Ventures AI fund (13 Aug 2026) |
Insider check: net selling — in the last 90 days CEO Sanjay Mehrotra sold 80,000 shares (24 Jul and 21 Aug 2026, about US$76.1m), then-EVP Sumit Sadana 15,000 (18 Aug, about US$14.0m) and CAO Scott Allen 879 (23 Jul, about US$0.9m); the only open-market purchase in 12 months was director Teyin Liu’s 23,200 shares at US$337.14 on 13 Jan 2026 (SEC Form 4 filings via secform4). Whether the CEO’s fixed 40,000-share monthly sales are under a 10b5-1 plan is not verified; Oct–Dec 2025 filings were not reachable.
3. Financial Health
| US$m | FY21 | FY22 | FY23 | FY24 | FY25 | FY26 | FQ4 FY26 |
|---|---|---|---|---|---|---|---|
| Revenue | 27,705 | 30,758 | 15,540 | 25,111 | 37,378 | 133,188 | 54,229 |
| Gross margin (GAAP) | 37.6% | 45.2% | 2.7% | 22.4% | 39.8% | 80.7% | 86.8% |
| Operating income | 6,283 | 9,709 | −3,574 | 1,305 | 9,809 | 99,340 | ≈43,750 |
| Net income | 5,861 | 8,687 | −5,833 | 778 | 8,539 | 84,969 | 37,701 |
| Diluted EPS (US$) | 5.14 | 7.75 | −5.34 | 0.70 | 7.59 | 74.33 | 32.87 |
| Operating cash flow | 12,468 | 15,181 | 1,559 | 8,507 | 17,525 | 89,675 | ≈43,970 |
| Capex (gross) | 10,030 | 12,067 | 7,676 | 8,386 | 15,857 | 30,712 | 11,110 |
| Free cash flow | 2,438 | 3,114 | −6,117 | 121 | 1,668 | 58,963 | ≈32,860 |
| Cash & investments* | 10,464 | 11,200 | 10,656 | 9,342 | 12,130 | 73,453 | |
| Total debt | 6,776 | 7,576 | 13,999 | 14,078 | 15,352 | 5,179 | |
| Equity | 43,933 | 49,907 | 44,120 | 45,131 | 54,165 | 138,378 |
FY2021 from the FY2021 release (FCF = OCF − capex); FY2022–26 from stockanalysis (cash flow, balance sheet), FY2026 cross-checked to the FQ4 release. FQ4 FCF = operating cash flow − gross capex; on Micron’s own “adjusted free cash flow” basis (net of capex proceeds) FQ4 was US$33.20bn and FY2026 US$62.31bn. *Cash & investments: FY2021 and FY2026 are Micron’s reported totals including restricted cash; FY2022–25 are stockanalysis cash, short-term and long-term investments.
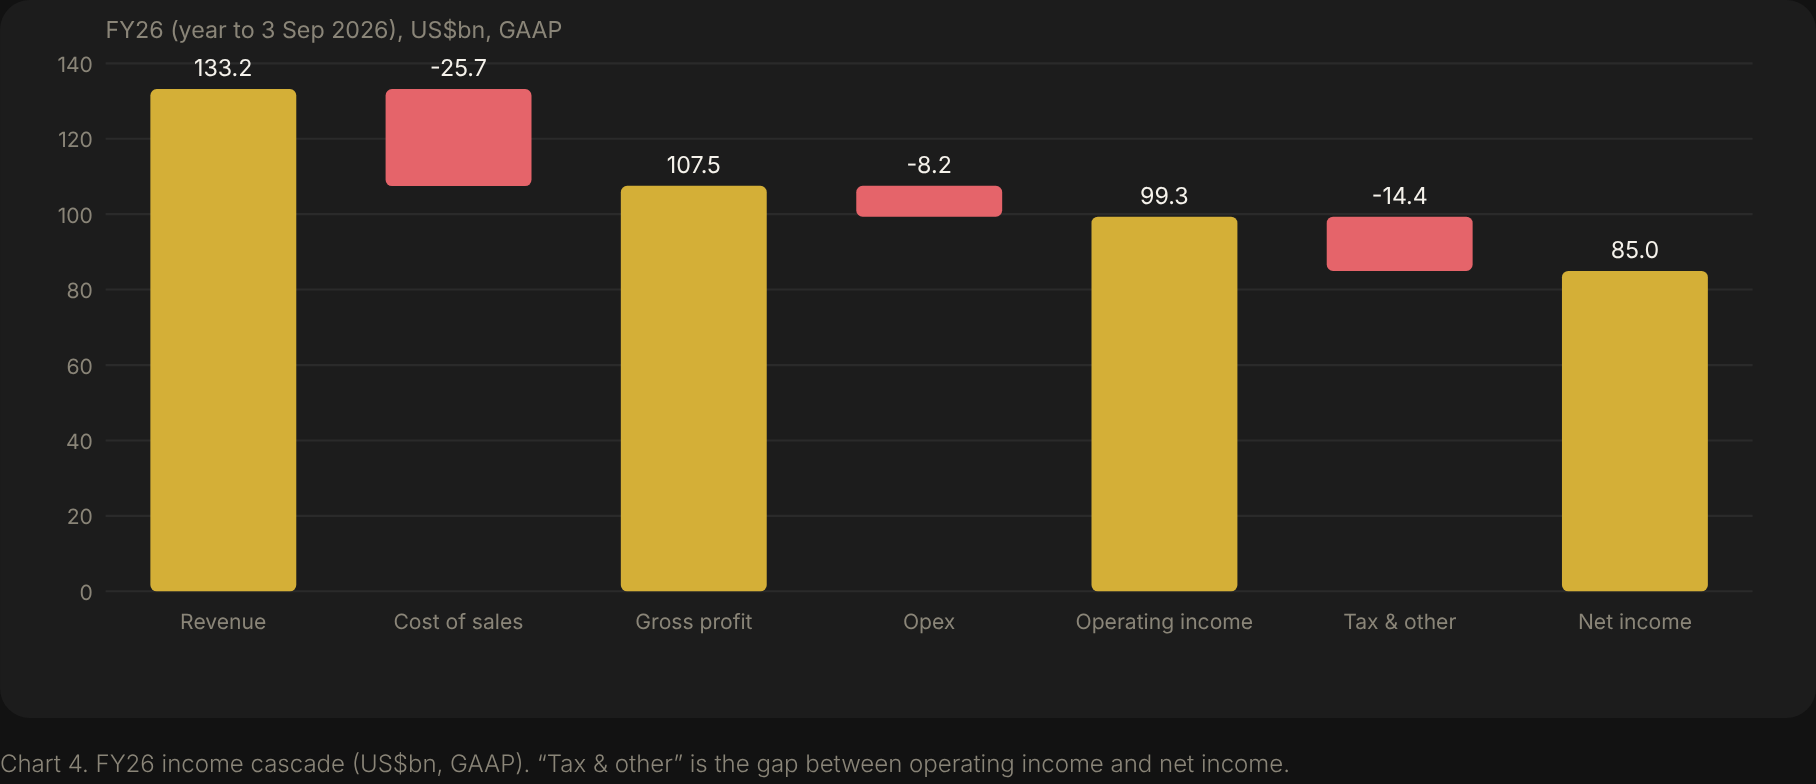
- Cash backs the profit: FY2026 operating cash flow of US$89.7bn was 1.06x net income of US$85.0bn.
- Deposits flatter cash flow: non-current customer contract liabilities rose by about US$12.3bn in FQ4, to US$12.9bn at year-end (US$12.75bn of deposit proceeds in FY2026); they are tied to future deliveries, not extra profit.
- Capex is about to jump: about US$25bn in 1H FY2027 and more in 2H, vs US$30.7bn gross in all of FY2026 — free cash flow will lag earnings in FY2027.
- Small adjustments: FY2026 GAAP EPS US$74.33 vs non-GAAP US$75.52; share-based pay US$1.33bn (1.0% of revenue).
4. Risks
Macro & Regulatory
- Serious: China — the 2023 CAC ban on purchases by critical-infrastructure operators still limits sales, and Micron is reported to be leaving China data-centre server chips (about 12% of FY2025 revenue in China) (10-K, The Standard).
- Watch: US export controls and tariffs on semiconductors and equipment; no new action against Micron found in 2026.
- Watch: high rates — the US 10-year yield is 5.31% (FRED), which raises the discount rate on long-dated fab investments.
Operational & Competitive
- Critical: the memory cycle — industry capex and wafer-fab equipment spending (about US$145bn in 2026 and US$156bn in 2027, per Trefis) point to oversupply risk in 2027–28; every past upcycle ended with a 50–70% share-price fall.
- Serious: HBM position — Micron is reported to be number three in HBM with the smallest share of NVIDIA’s HBM4 allocation (AI Weekly).
- Serious: customer concentration — the top ten customers are about half of revenue.
- Watch: execution on new capacity — Idaho fab 1 wafer output is due mid-2027, fab 2 late 2028, and New York around 2030.
Financial & Governance
- Watch: capex step-up — FY2027 capex likely above US$50bn (US$25bn in 1H, higher in 2H) commits cash before demand is proven.
- Watch: steady insider selling by the CEO and other executives through 2026; one director purchase.
- Watch: take-or-pay contracts reduce, but do not remove, pricing risk; their price terms are not disclosed.
5. Catalysts
| When | Measurable test | Odds |
|---|---|---|
| 14 Oct 2026 | Dividend record date (US$0.15) | Scheduled |
| Oct 2026 | FY2026 10-K filed: segment, geography and customer detail | High |
| From 9 Dec 2026 | Larger buyback authorisation and faster returns, as flagged on the call | 65% |
| FQ1 FY2027 results (date not announced; last year 17 Dec) | Revenue ≥ US$61.5bn and non-GAAP gross margin ≥ 86.0% | 60–65% |
| CY2027 | HBM bit supply for 2027 mostly contracted at higher prices — confirmation in pricing commentary | Medium |
| Mid-2027 | Idaho fab 1 first wafer output | Medium |
Bull case vs consensus: consensus has FY2027 revenue of US$275.0bn (+106.5%) and EPS of US$176.15 from 39 analysts; 45 of 49 analysts rate the shares Buy or Strong Buy with a mean target of US$1,536 (stockanalysis). Our base case accepts FY2027 consensus but not its persistence; the bull case (fair value US$1,620) needs margins above 60% through FY2031.
6. Valuation Suite
6a. Cost of Capital
| Input | Value | Source / note |
|---|---|---|
| Risk-free (US 10-year Treasury, 5 Oct 2026) | 5.31% | FRED DGS10 |
| Own 2-yr weekly beta vs S&P 500 | 2.46 | IBKR weekly closes, 104 weekly returns to the week of 5 Oct 2026; SPY as the index proxy |
| Peer median beta (check) | 2.08 | stockanalysis 5-year betas of the 7 peers in 6d with a beta (SNDK n/a) |
| Raw beta used | 2.27 | Average of the two (gap 0.38 > 0.3), per method |
| Adjusted beta (0.67×raw+0.33) | 1.85 | |
| Equity risk premium | 5.0% | Developed market (assumption) |
| Size/illiquidity premium | 0% | About US$1.2tn market value |
| Cost of equity | 14.6% | Used in DCF, residual income and peer discounting |
| Debt weight / after-tax cost of debt | 0.4% / 5.0% | US$5.18bn debt; risk-free + 1% spread (assumption) × (1 − 21%) |
| WACC | 14.5% |
6b. Discounted Cash Flow (DCF)
| US$bn | FY27E | FY28E | FY29E | FY30E | FY31E |
|---|---|---|---|---|---|
| Revenue | 275 | 250 | 200 | 210 | 220 |
| Growth | +106.5% | −9.1% | −20.0% | +5.0% | +4.8% |
| EBITDA | 239.2 | 195.0 | 120.0 | 115.5 | 121.0 |
| EBITDA margin | 87% | 78% | 60% | 55% | 55% |
| D&A | 12.0 | 14.5 | 17.0 | 19.0 | 21.0 |
| Capex | 55.0 | 55.0 | 45.0 | 40.0 | 40.0 |
| FCFF | 151.3 | 113.8 | 60.1 | 61.5 | 66.5 |
| Present value | 133.9 | 88.0 | 40.5 | 36.2 | 34.2 |
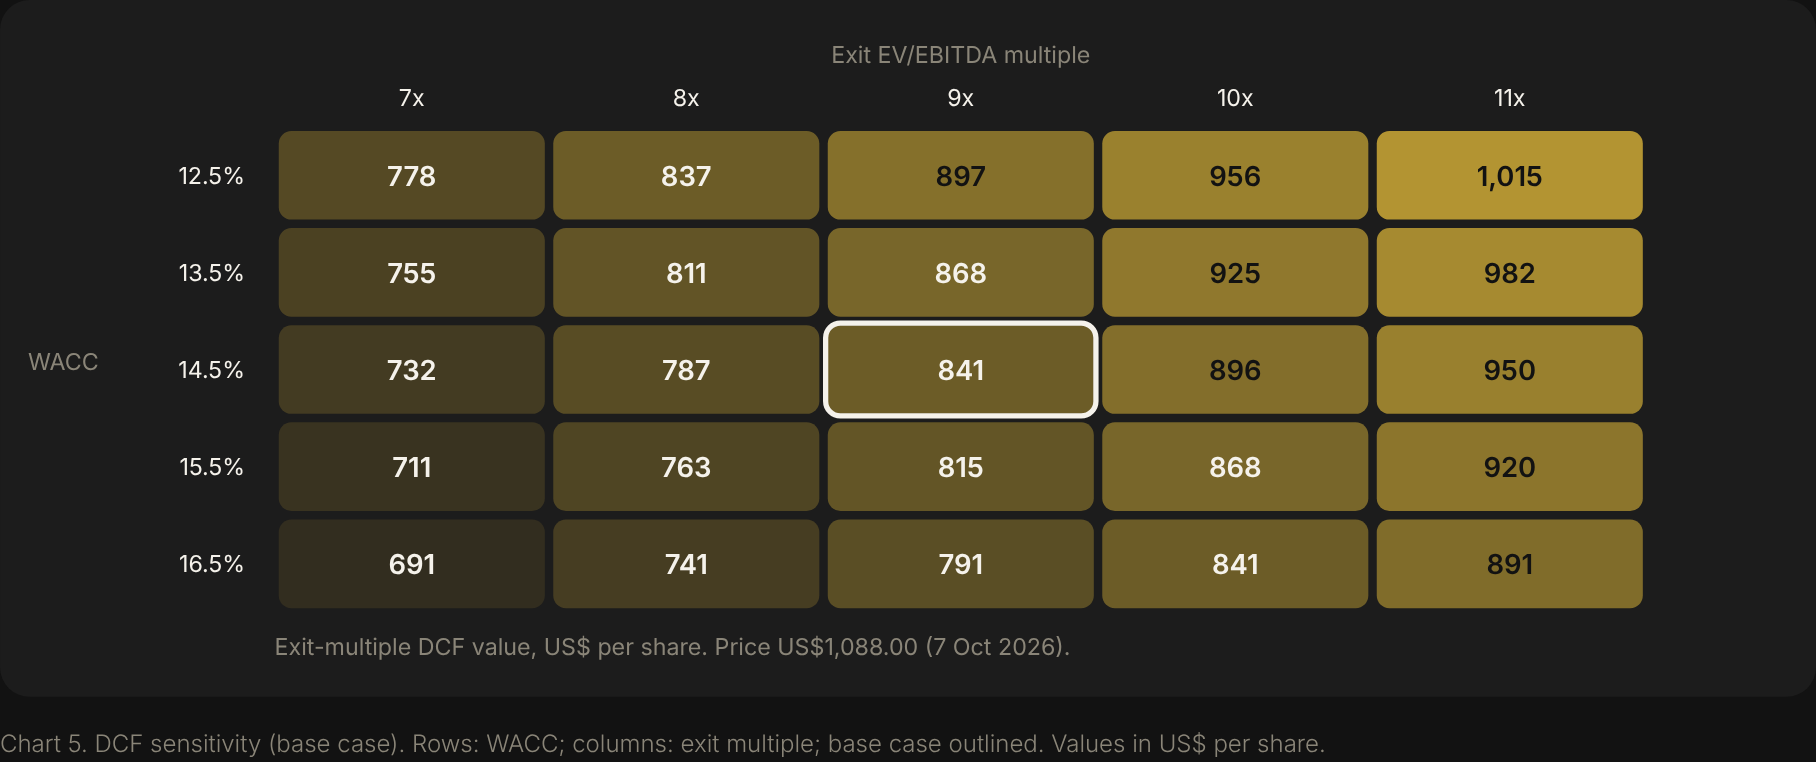
Operating company valued on unlevered free cash flow at the 14.5% WACC: FCFF = EBIT × (1 − 14.5% tax) + D&A − capex (tax rate implied by FY2026 net income ÷ operating income; working capital and customer deposits ignored). Revenue is a price × volume view: FY2027 = consensus US$275.0bn (only FQ1 is guided: US$61.5bn); FY2028 −9% and FY2029 −20% as new DRAM/NAND capacity lowers prices, then +5% a year. Capex follows the guided step-up (US$55bn in FY2027–28). Cash flows are discounted from each fiscal year-end (the first 0.9 years away). Terminal: perpetuity growth 3.0% (assumption, below US nominal GDP growth) and an exit EV/EBITDA of 9x on FY2031 EBITDA, averaged. Add net cash US$68.3bn; divide by 1.143bn diluted shares.
| Case | Key differences | Perpetuity (g) | Exit multiple | DCF value |
|---|---|---|---|---|
| Bear | FY27 revenue US$250bn, then −20% and −30%; EBITDA margin 45–50% from FY29 | US$383 (g 2.5%) | US$496 (7x) | US$440 |
| Base | Consensus FY27, then −9%, −20%, +5%; EBITDA margin 55% from FY30 | US$618 (g 3.0%) | US$841 (9x) | US$730 |
| Bull | FY27 US$300bn, FY28 US$330bn, mild FY29 dip; EBITDA margin 62–88% | US$1,105 (g 3.5%) | US$1,588 (11x) | US$1,346 |
Implied discount rate: the base-case cash flows equal today’s US$1,088.00 price at 8.4%, versus our 14.5% WACC.
6c. Residual Income
| US$ per share | FY27E | FY28E | FY29E | FY30E | FY31E |
|---|---|---|---|---|---|
| Opening book | 121.1 | 292.0 | 427.9 | 505.8 | 578.9 |
| EPS (base case) | 171.5 | 136.5 | 78.5 | 73.7 | 76.3 |
| ROE (on opening book) | 141.6% | 46.8% | 18.4% | 14.6% | 13.2% |
| Residual income | 153.9 | 94.0 | 16.2 | 0.0 | −8.0 |
Starting book value US$138.4bn (equity at 3 Sep 2026; US$121.07 a share on 1.143bn diluted shares), US$0.60 a share paid out, cost of equity 14.6%. As book value builds up from retained peak earnings, ROE falls to about 13% by FY2031 — below the cost of equity — so residual income turns negative. Value with full persistence US$297 a share; with 50% persistence US$331; average US$314. Justified P/B = (ROE − g)/(CoE − g) = 1.07x at a 15.4% FY2029–31 ROE (US$129 a share). Micron is capital-heavy (fabs) and trades below 10x book (8.9x), so book value is the capital at work. Weight in fair value: 30%.
6d. Peers (stockanalysis, prices at 7 Oct 2026)
| Ticker | Price | Mkt cap | Fwd P/E | EV/EBITDA | 3-yr growth fcst |
|---|---|---|---|---|---|
| MU (Micron) | US$1,088.00 | US$1.23tn | 6.18 | 10.66 | 33.5% |
| SNDK (Sandisk) | US$1,692.42 | US$247.8bn | 7.89 | 19.14 | 40.7% |
| WDC (Western Digital) | US$405.42 | US$151.8bn | 20.15 | 30.26 | 34.5% |
| STX (Seagate) | US$807.57 | US$183.6bn | 22.52 | 40.78 | 36.4% |
| NVDA (NVIDIA) | US$237.47 | US$5.73tn | 19.78 | 28.31 | 61.1% |
| AVGO (Broadcom) | US$376.51 | US$1.80tn | 21.69 | 34.92 | 62.1% |
| AMD (AMD) | US$645.86 | US$1.05tn | 58.16 | 109.34 | 52.9% |
| QCOM (Qualcomm) | US$177.12 | US$189.1bn | 19.53 | 16.34 | 5.4% |
| TXN (Texas Instruments) | US$288.98 | US$263.9bn | 30.71 | 28.16 | 16.0% |
| Peer median (ex MU) | 20.92 | 29.29 |
Peer method: median forward P/E of all eight profitable peers (20.9x) × Micron’s mid-cycle EPS of US$107.31 (the average of our base-case FY2027–31 EPS, used instead of peak FY2027 EPS because peers’ forward earnings are not at a cyclical peak) = US$2,245 a year out, discounted one year at the 14.6% cost of equity = US$1,959. FY2028 (FY+2) consensus EPS is NOT FOUND, so the mid-cycle path replaces it. For reference, the same multiple on FY2027 consensus EPS of US$176.15 gives US$3,217; the closest pure memory peer, Sandisk, trades on only 7.9x. Cross-check: Micron’s EV/EBITDA of 10.7x vs a peer median of 29.3x.
6e. Single-lever Test
| Input changed alone | Low | High | Swing |
|---|---|---|---|
| Peer P/E on mid-cycle EPS 15x / 25x | US$808 | US$1,089 | US$281 |
| FY2029–31 revenue −20% / +20% | US$849 | US$1,099 | US$250 |
| FY2029–31 EBITDA margin 45% / 65% | US$852 | US$1,075 | US$223 |
| WACC 12.5% / 16.5% (DCF leg) | US$950 | US$1,004 | US$54 |
| Exit EV/EBITDA 7x / 11x | US$952 | US$996 | US$44 |
| Capex +15% / −15% | US$960 | US$987 | US$27 |
The biggest lever is the P/E applied to mid-cycle earnings: 15x–25x moves fair value from US$808 to US$1,089; the FY2029–31 revenue path is a close second.
7. Synthesis
| Method | Inputs | Value | vs price | Weight | Weighted |
|---|---|---|---|---|---|
| DCF (FCFF) | Perpetuity 3.0% and 9x exit, averaged; WACC 14.5% | US$730 | −32.9% | 40% | US$292 |
| Residual income | Book US$121.07, CoE 14.6%, full/50% persistence | US$314 | −71.1% | 30% | US$94 |
| Peers | 20.9x × mid-cycle EPS US$107.31, discounted 1 year | US$1,959 | +80.1% | 30% | US$588 |
| Fair value | US$974 | −10.5% | 100% | US$974 | |
| Bear / Base / Bull | Same weights on each case | US$635 / US$974 / US$1,620 | −41.6% / −10.5% / +48.9% |
How much rests on consensus: valuing the peer leg on the bear-case EPS path (FY2027 revenue US$250bn, then a sharper 2028–29 downturn) cuts it to US$1,325 and fair value to US$784 (−28.0%). Fair value on FY2027 consensus EPS at face value would be far higher, which is why we do not use peak earnings.
Margin of safety: fair value is 10.5% below the price (the price is 11.7% above fair value), so there is no margin of safety; a 30% discount to fair value would be US$682. The implied discount rate of 8.4% is well below our 14.5% WACC.
8. Technicals
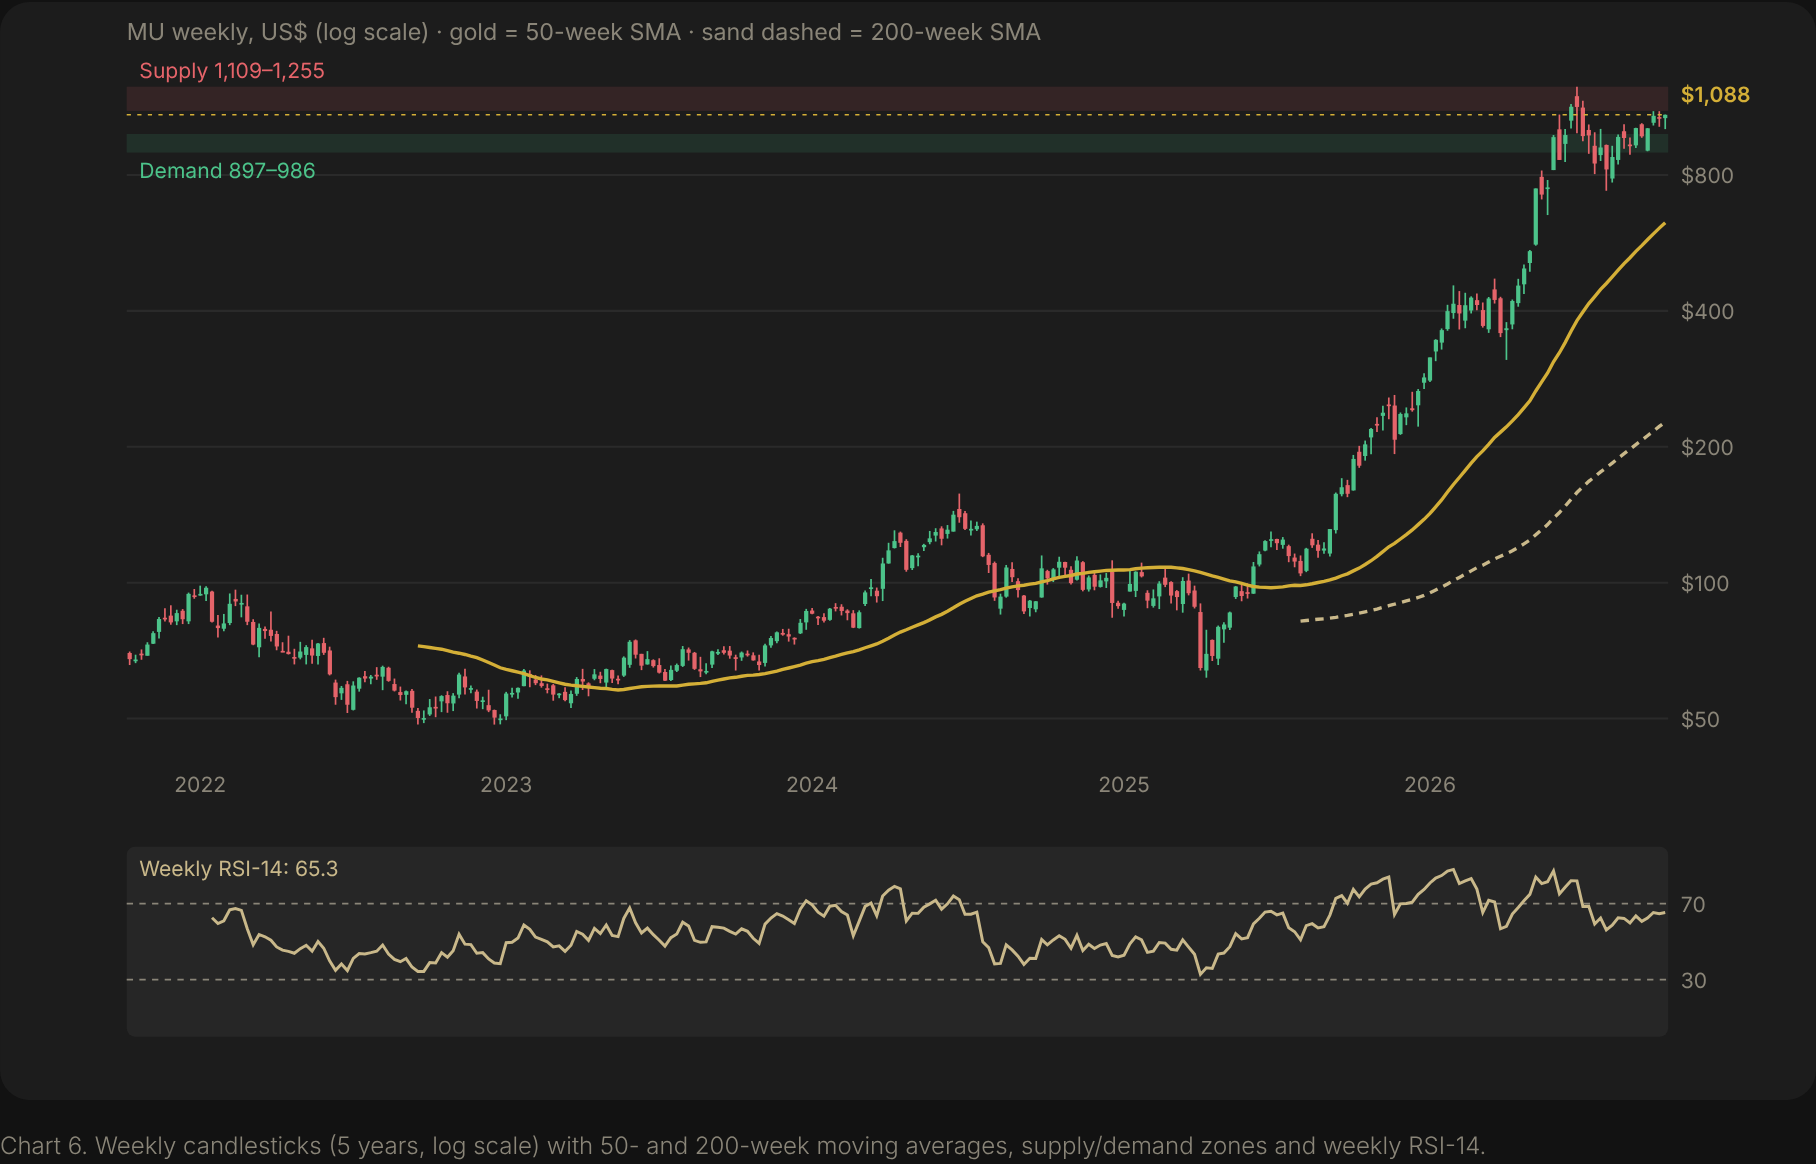
- Trend: up. The close of US$1,088.00 is above the 50-day (US$967.16), 100-day (US$962.69) and 200-day (US$694.07) averages and far above the 50-week (US$627.57) and 200-week (US$227.00) averages. The 50-day has been above the 200-day for every session we can measure (last 52); the date of the last cross is outside our one-year data.
- Momentum: neutral-to-positive. Daily RSI-14 59.7, weekly RSI-14 65.3; the daily MACD histogram is −0.6 vs +5.4 a week ago, so upside momentum has faded.
- Volatility: 20-day average true range US$43.59 (4.0% of price); the shares swung between US$737.88 and US$1,108.72 in the last three months.
- Volume: 21.9m shares traded on 7 Oct (IBKR daily bar) vs a 90-session average of about 25.1m shares (about US$24.5bn a day); the heaviest one-year volume-by-price nodes are US$897–941 and US$941–986 and, from the early-2026 base, US$359–448.
| Level | Price | Basis |
|---|---|---|
| Resistance 2 | US$1,255.00 | 52-week and all-time high (week of 22 Jun 2026) |
| Resistance 1 | US$1,108.72 | One-month and three-month high |
| Current | US$1,088.00 | 7 Oct 2026 close |
| Support 1 | US$897–986 | High-volume nodes (897–941 and 941–986); 50-day average US$967.16 |
| Support 2 | US$902.60 | One-month low |
| Support 3 | US$737.88 | Three-month low (Jul–Aug 2026 sell-off) |
Our Dated Calls
Pre-registered calls, scored publicly on the dates shown; price calls use total return after typical trading costs (about 0.1%).
| # | Call | Probability | Scoring date |
|---|---|---|---|
| 1 | FQ1 FY2027 revenue ≥ US$61.5bn (guidance midpoint) | 65% | 15 Jan 2027 |
| 2 | FQ1 FY2027 non-GAAP gross margin ≥ 86.0% | 60% | 15 Jan 2027 |
| 3 | Micron announces a new or enlarged share-buyback authorisation | 65% | 15 Jan 2027 |
| 4 | FY2027 consensus revenue (stockanalysis) ≥ US$275bn | 55% | 15 Jan 2027 |
| 5 | MU total return from US$1,088.00 is negative after costs | 50% | 7 Apr 2027 |
| 6 | MU closes below US$900 at least once | 50% | 7 Apr 2027 |
Bull Case
- Contracts change the cycle: 26 take-or-pay agreements covering more than 35% of revenue through 2030 and about US$150bn of remaining performance obligations could keep prices firm.
- Management sees no let-up: it expects supply to stay tight through FY2027–28 and called FQ1 the floor for FY2027 gross margins.
- Cheap if earnings hold: at 6.2x forward EPS with US$68.3bn net cash, margins above 60% through FY2031 give a fair value of US$1,620 (+48.9%).
Bear Case
- Peak earnings, peak margins: an 87% gross margin in a commodity industry has never lasted; past downturns cut the shares by 50–70%.
- Everyone is building: industry wafer-fab equipment spending of about US$145bn in 2026 and US$156bn in 2027 points to oversupply in 2027–28, just as Micron lifts capex above US$50bn.
- Insiders are sellers: the CEO sold 40,000 shares a month through mid-2026; on the bear path fair value is US$635 (−41.6%).
FAQ
What is Micron’s fair value?
Our 12-month fair value is US$974 per share (range US$635–US$1,620), from 40% DCF (US$730), 30% residual income (US$314) and 30% peers (US$1,959).
Is Micron undervalued?
No — at US$1,088.00 (7 Oct 2026 close) it is fairly valued on our numbers, −10.5% vs fair value. It looks cheap on 6.2x forward earnings, but those earnings are near a cyclical peak.
What are the main risks for Micron?
The memory cycle (industry capacity additions in 2027–28), a weaker HBM position than its two rivals, customer concentration (top ten ≈ half of revenue) and China restrictions.
When are Micron’s next results?
FQ1 FY2027 (quarter to early December 2026) has no announced date yet; last year’s FQ1 report came on 17 Dec 2025. Guidance is US$61.5bn ± US$1.5bn of revenue.
Does Micron pay a dividend?
Yes — US$0.15 a quarter (US$0.60 a year, 0.06% yield). The next one has a record date of 14 Oct 2026 and is paid on 29 Oct 2026.
Method and Sources
Fair value blends a five-year unlevered DCF (40%; perpetuity growth and exit EV/EBITDA averaged), a residual-income model (30%) and a peer forward P/E on mid-cycle EPS (30%), all at one discount rate: cost of equity 14.6% from the US 10-year yield (5.31%), an adjusted beta of 1.85 (own two-year weekly beta 2.46 averaged with the peer median 2.08) and a 5% equity risk premium; WACC 14.5%. Prices and technicals are from IBKR daily and weekly bars to 7 Oct 2026; the IBKR snapshot showed higher 7 Oct volume than the daily bar, and we use the saved daily bars throughout. Consensus differs by source (Yahoo: FY2027 revenue US$245.6bn; stockanalysis: US$275.0bn); we use stockanalysis. Figures independently fact-checked against the linked sources on 8 Oct 2026.
- Company and SEC: FQ4 FY2026 8-K release · FQ2 FY2026 release · FQ1 FY2026 release · FY2021 release · FY2025 10-K · Form 4 filings (secform4) · Leadership release
- Calls and news: FQ4 call transcript · MarketBeat call summary · Mitrade · Stocktwits · The Standard (Reuters) · StockTitan · StockTitan · stockti · FourWeekMBA · ValueTheMarkets · AI Weekly · Tom’s Hardware · The Next Web · Trefis · Seeking Alpha
- Data and consensus: stockanalysis financials · quarterly · cash flow · balance sheet · statistics · forecast · Yahoo analysis · MarketBeat forecast · Simply Wall St ownership · MarketScreener calendar
- Rates and index: FRED DGS10 · S&P DJI 1 Oct 2026 index changes · S&P 500 constituents
Not located (NOT FOUND): the FY2026 10-K (not yet filed) and with it the FY2026 geographic split and single-customer shares; FY2028 consensus; HBM revenue; FY2026 DRAM/NAND split; CEO pay from the primary proxy; credit ratings; 10b5-1 status of executive sales and Form 4s for Oct–Dec 2025; the FQ1 FY2027 results date; a count of in-depth analyses in the last 90 days.
Analysis only, not a recommendation to buy or sell any security. Figures as at 7 Oct 2026; sources linked. The author does not hold a position in MU.
Get the next report by email
One independent, fact-checked equity research report each weekday on Singapore and US stocks, with every prediction scored in public. Free.


Leave a comment