
Download the full report (PDF)
Snapshot
| Item | Value |
|---|---|
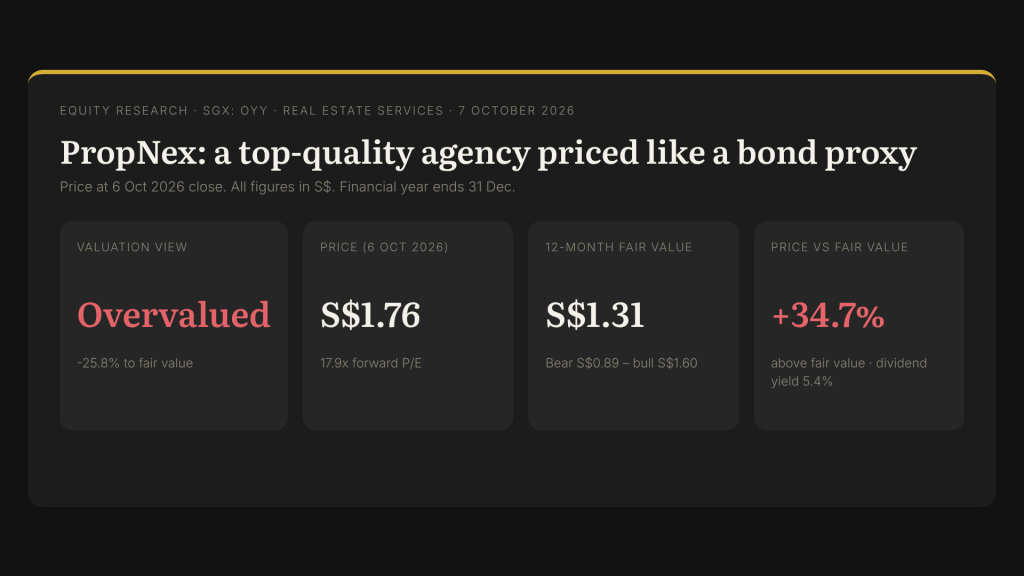
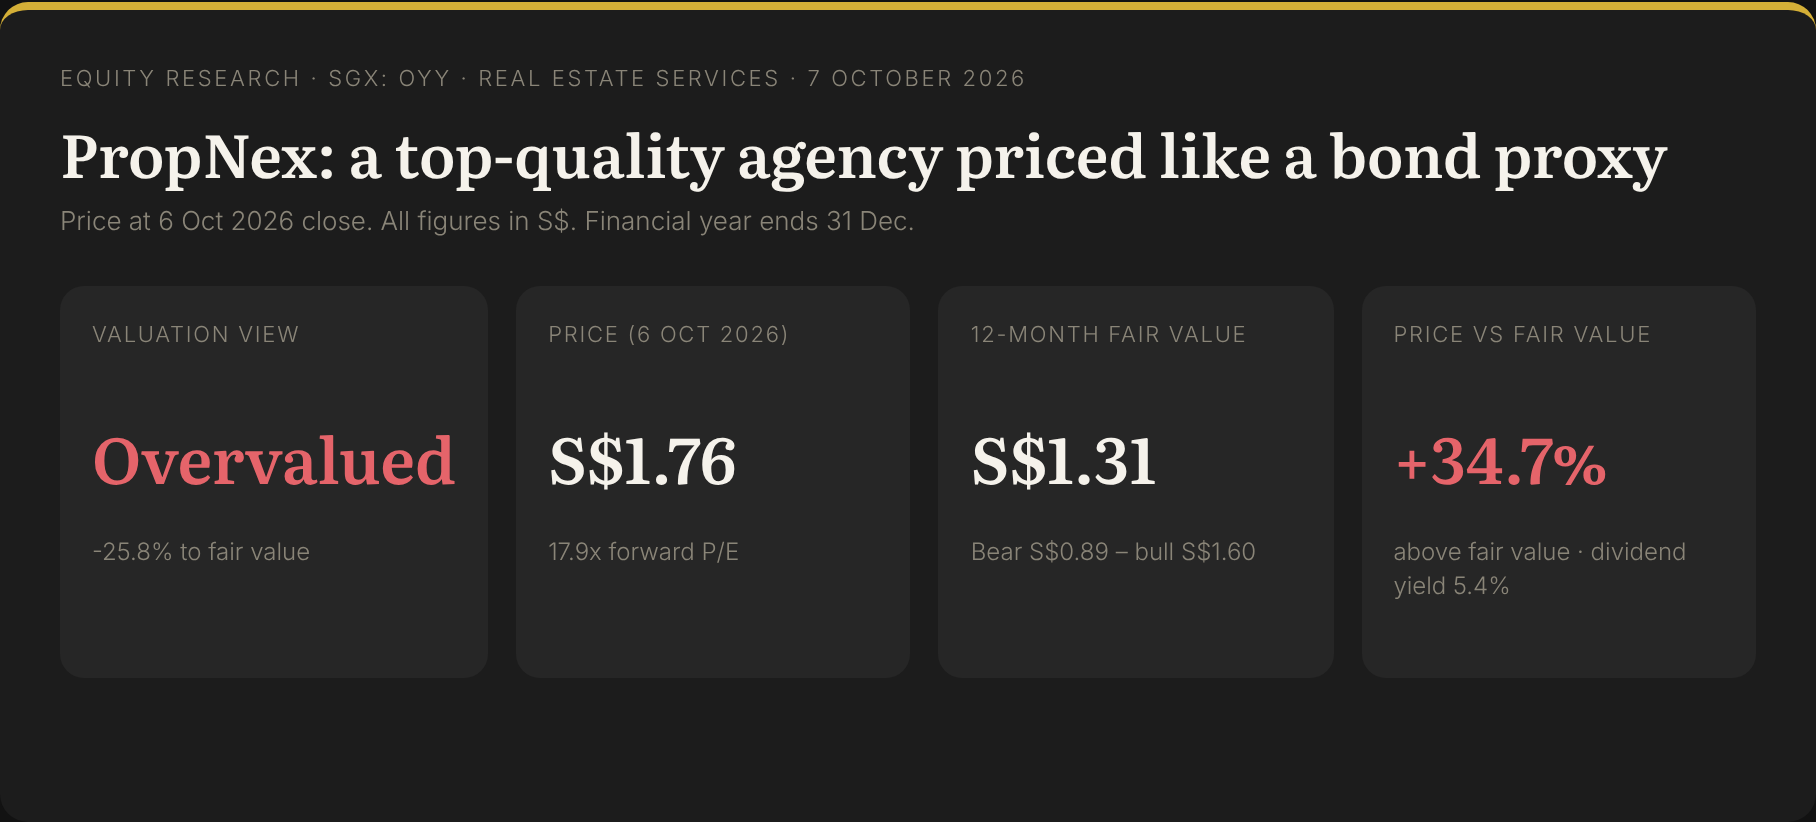
| Valuation view | Overvalued (-25.8% to fair value) |
| Current price | S$1.76 (6 Oct 2026 close; 17.9x forward P/E) |
| 12-month fair value | S$1.31 (50% DCF / 50% peers) |
| Bear–bull range | S$0.89 (-49.3%) to S$1.60 (-9.1%) |
| Dividend yield | 5.4% (4.5c final FY2025 + 5.0c interim 1H2026) |
Key Takeaways
- Overvalued: our fair value is S$1.31 vs S$1.76 (-25.8%), with a range of S$0.89–S$1.60; even our bull case sits below the price.
- A great business, a full price: PropNex earned a 60.6% return on equity in FY2025, holds 64.3% of Singapore HDB and private residential transactions and pays out almost all its profit (9.5c a share, 5.4% yield) (Annual Report 2025, 1H2026 business update).
- Growth has stalled for now: 1H2026 revenue rose 0.7% to S$603.0m while PATMI fell 3.1% to S$40.9m as project-marketing commissions dropped 7.8% (1H2026 results); at S$1.76 the shares price in a 7.3% discount rate vs our 9.6% cost of equity.
The Verdict
Overvalued — fair value S$1.31 (range S$0.89–S$1.60), -25.8% vs S$1.76 (6 Oct 2026 close).
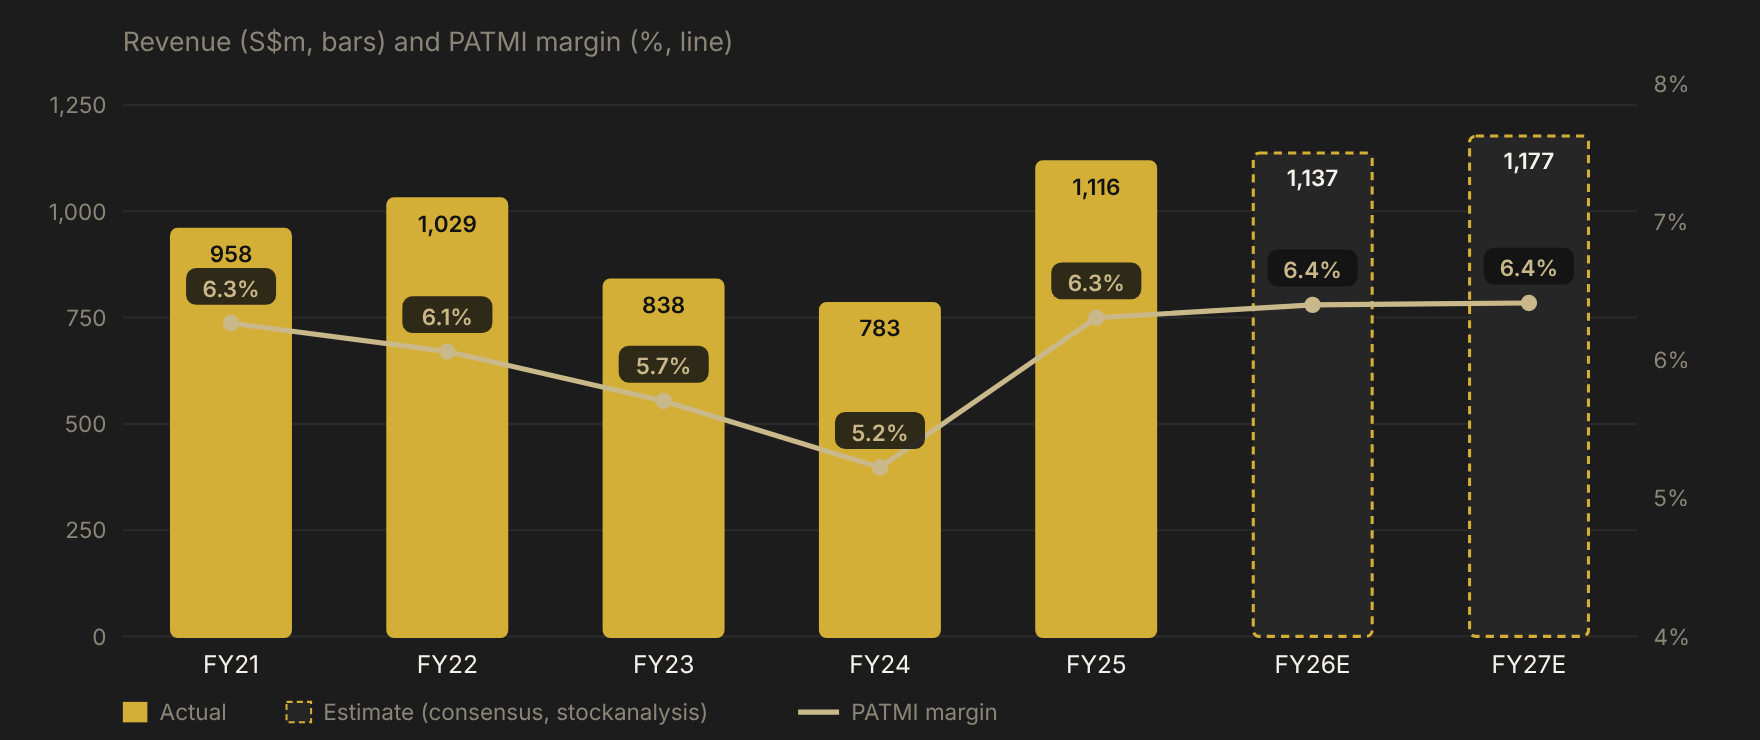
What is working: PropNex is Singapore’s largest property agency, with 14,574 salespersons on 3 Aug 2026 (38.1% of the country’s agents on 1 Jul 2026) and a 64.3% share of HDB and private residential transactions in 1H2026 (1H2026 press release, business update). FY2025 was a record: revenue S$1,116.4m (+42.6%) and PATMI S$70.4m (+72.0%) as new-launch sales lifted project-marketing commissions to S$434.0m (FY2025 results). The balance sheet has no bank debt and S$130.2m of cash at 30 Jun 2026 (1H2026 results).
What the price already assumes: the shares are down 6.4% this year (from S$1.88 at 31 Dec 2025) and 33.1% below the 52-week high of S$2.63 (10 Oct 2025, IBKR, unadjusted for dividends). At S$1.76 they trade on 17.9x FY2026 consensus EPS (about 9.8 cents) and 10.5x book. Our base case uses consensus revenue growth of +1.9% for FY2026 and +3.5% for FY2027 (stockanalysis consensus) with a stable net margin of about 6.4%; those cash flows equal today’s price only at a 7.3% discount rate, against our 9.6% cost of equity.
The single factor that decides it: whether a near-100% dividend payout from a cyclical, agent-driven business deserves a bond-like 7.3% discount rate. The shares behave defensively (own 2-year weekly beta 0.63 vs the STI), but earnings swing with new-launch volumes — PATMI fell from S$62.4m in FY2022 to S$40.9m in FY2024 before rising 72% to S$70.4m in FY2025. If the 2027 launch pipeline (potentially about 11,000 units, per Phillip Securities) lifts margins back to FY2025 levels and above, the bull case (S$1.60) comes into view; a repeat of 2023–24 points to the bear case (S$0.89).
Recent Developments (Last 12 Months)
| Date | Event | Why it matters |
|---|---|---|
| 17 Oct 2025 | Claimants withdraw a lawsuit against subsidiary PropNex Realty; no material FY2025 impact (TipRanks) | Litigation overhang eases |
| 24 Oct 2025 | Pebble Sia Huei-Chieh appointed independent director (from 1 Nov 2025) (MarketScreener) | Board renewal |
| 8 Dec 2025 | Independent director Low Wee Siong resigns, effective 4 Jan 2026 (MarketScreener) | Board turnover |
| 5 Jan 2026 | A second lawsuit against PropNex Realty withdrawn (Tiger Brokers) | Overhang removed |
| 26–27 Feb 2026 | FY2025: revenue S$1,116.4m (+42.6%), PATMI S$70.4m; final dividend 4.5c, FY total 9.5c (SGX, EdgeProp) | Record base for 2026 |
| 2 Apr 2026 | Share buy-back mandate renewal proposed; no shares bought in the prior 12 months (SGX appendix); director Kan Yut Keong retires (MarketScreener) | No buybacks used |
| 17 Apr 2026 | Marcus Luah appointed Chief Growth Officer, a new recruitment role (EdgeProp) | Supports agent growth |
| 27 Apr / 8 May 2026 | FY2025 final dividend 4.5c (ex 27 Apr, paid 8 May) (stockanalysis) | Yield support |
| 1 Jul 2026 | Danny Lim Teck Chai joins as independent director; board is 2 executive + 3 independent (SGX) | Governance |
| 10 Jul 2026 | Another lawsuit against the subsidiary discontinued; no FY2026 impact (minichart) | Litigation keeps recurring but has not cost money |
| 28 Jul 2026 | Government removes the 15-month wait-out for private homeowners buying HDB resale flats (The Star) | Positive for HDB resale volumes |
| 13 Aug 2026 | 1H2026: revenue S$603.0m (+0.7%), PATMI S$40.9m (-3.1%); interim 5.0c (SGX); shares fell 3.2% intraday (Tiger) | First profit dip of this cycle |
| 14–22 Aug 2026 | iFAST BUY, target S$2.70 (minichart); Phillip ACCUMULATE, S$2.08 (POEMS); Beansprout NEUTRAL, cut to S$1.94 from S$2.32 (Beansprout) | Brokers split |
| 25 Aug / 11 Sep 2026 | Interim dividend 5.0c (ex 25 Aug, paid 11 Sep) (SGX, stockanalysis) | Yield support |
| 27–28 Sep 2026 | Chairman outlines a push into industrial property in a Business Times interview (Business Times via redhot) | New growth story |
| 1 Oct 2026 | URA 3Q2026 flash: private home prices +1.4% q/q; volumes down about 30% q/q (URA) | Volumes, not prices, drive commissions |
| Late Feb 2027 (expected) | Next: FY2026 results (not yet announced; FY2025 results came on 26–27 Feb 2026) | Test of the 2H2026 recovery |
Key numbers
| Metric | Value | Basis |
|---|---|---|
| Forward P/E | 17.9x | S$1.76 ÷ FY2026 consensus EPS ~9.84c (FY2025 EPS 9.51c +3.5%, stockanalysis) |
| P/B | 10.5x | NAV 16.73c a share at 30 Jun 2026 |
| Revenue growth | +0.7% / +42.6% | 1H2026 y/y / FY2025 y/y |
| Cost of equity | 9.6% | SGS 10y 2.50% + β 1.02 × 5% + 2% size/illiquidity |
| Market share | 64.3% | HDB + private residential transactions, 1H2026 (company) |
| From 52-week high | -33.1% | 52-week range S$1.61–2.63 (IBKR) |
1. Business & Moat
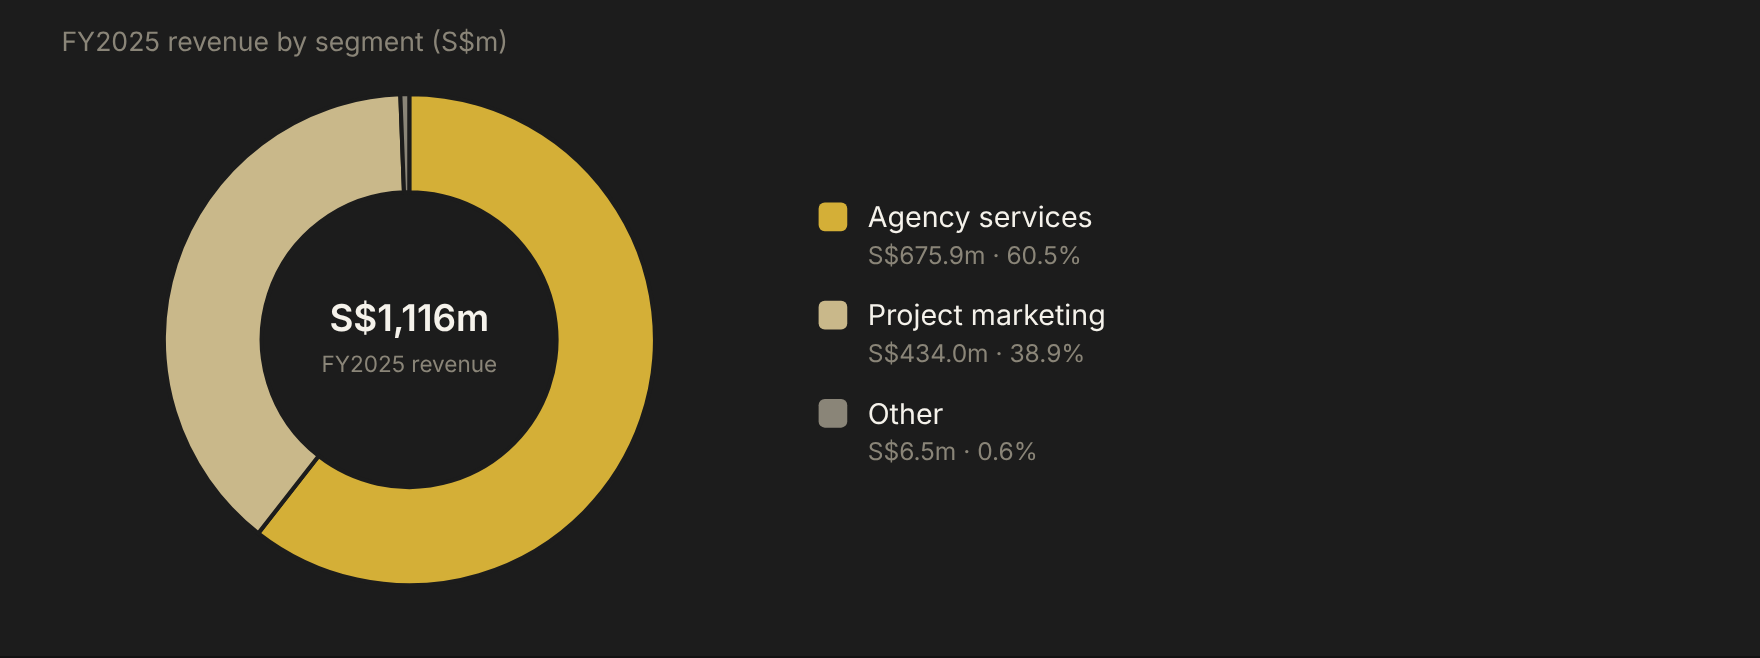
PropNex Limited is a Singapore real-estate agency group listed on the SGX Mainboard (ticker OYY, IBKR contract “PROPNEX LTD”). It earns commissions from two businesses: agency services (resale and rental transactions) and project marketing (selling new developments for developers), and franchises its brand in Indonesia, Malaysia, Vietnam and other markets. Most of each commission is passed on to its salespersons — cost of services was S$1,001.4m of S$1,116.4m revenue in FY2025 (FY2025 results). FY ends 31 December; the last reported period is 1H2026 (to 30 Jun 2026, released 13 Aug 2026).
| Segment | FY2025 S$m | Share | 1H2026 S$m | 1H2025 S$m |
|---|---|---|---|---|
| Agency services | 675.9 | 60.5% | 360.5 | 337.2 |
| Project marketing | 434.0 | 38.9% | 238.4 | 258.5 |
| Other | 6.5 | 0.6% | 4.1 | 3.3 |
| Total | 1,116.4 | 100% | 603.0 | 598.9 |
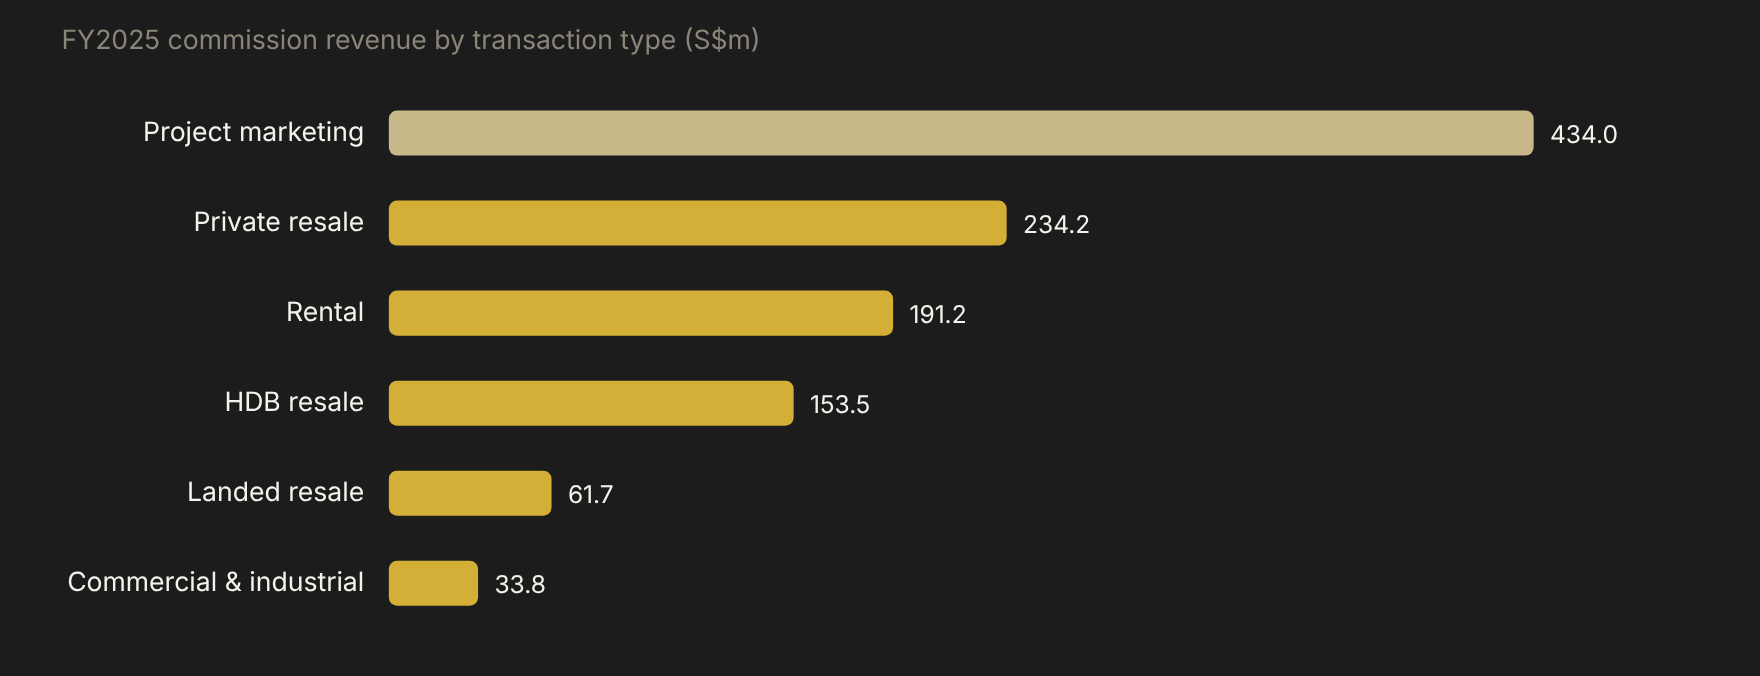
Sources: FY2025 results, 1H2026 results. Agency revenue in FY2025 split into private resale S$234.2m, rental S$191.2m, HDB resale S$153.5m, landed resale S$61.7m and commercial & industrial S$33.8m (Annual Report 2025). Customers are individual buyers, sellers, landlords and developers; no single customer is disclosed as material (NOT FOUND).
Guidance (13 Aug 2026): “cautiously optimistic about delivering a strong full year performance for 2026”; the group expects private home prices +3% to 4% in 2026, developers’ sales of about 9,000 units (ex-ECs), private resale volume of 14,000–15,000 units and HDB resale volume of about 26,000–27,000 (1H2026 results, press release). Management sees 13 projects / 4,222 units launching in 2H2026 (business update).
Porter’s Five Forces
| Force | Pressure | Comment |
|---|---|---|
| Rivalry | Medium | ERA (APAC Realty), Huttons and OrangeTee compete; PropNex has 38.1% of agents but 64.3% of transactions |
| New entrants | Low–medium | Licensing (CEA) is easy for small agencies, but developer project-marketing mandates favour scale |
| Substitutes | Low–medium | Direct developer sales and online listings exist; agents still handle most transactions |
| Buyer power | Medium | Developers negotiate project-marketing fees; homeowners can switch agents freely |
| Supplier power | High | Salespersons are the “suppliers” and keep about 90% of commissions; they can move agencies |
Moat verdict: narrow — scale and network. Size wins developer mandates and attracts agents, which wins more listings; that loop has lifted market share. But the economics are thin (a 6.3% net margin in FY2025), the agents own the client relationships, and earnings follow transaction volumes that PropNex cannot control.
2. Leadership & Capital Allocation
| Item | Detail |
|---|---|
| Executive Chairman | Mohamed Ismail S/O Abdul Gafoore (Ismail Gafoor), co-founder; CEO until 15 Jul 2025 (SGX) |
| CEO | Kelvin Fong Keng Seong, Executive Director and CEO from 15 Jul 2025 (previously Deputy CEO) (SGX) |
| CFO | Lee Li Huang, also Company Secretary (Annual Report 2025) |
| Board | 5 directors from 1 Jul 2026: 2 executive, 3 independent (Dr Ahmad Magad, Pebble Sia, Danny Lim) (SGX) |
| Control | P&N Holdings 55.63%; Ismail deemed 64.25%, co-founder Lim Tow Huat deemed 59.39%, Kelvin Fong deemed 10.26% (12 Mar 2026) (buy-back appendix) |
| Insider dealings (12 months) | None found (NOT FOUND) |
| Directors’ pay | NOT FOUND |
- Returns vs hurdle: ROE 60.6% in FY2025 and 33.2% in FY2024 (Annual Report 2025), far above our 9.6% cost of equity — because the business needs almost no capital.
- Dividends vs policy: stated policy is 75%–80% of PATMI; actual payout was 99.9% in FY2025 and 140.1% in FY2024 (Annual Report 2025); 1H2026 interim 5.0c was a 90.4% payout (press release).
- Buybacks and dilution: no shares bought in the 12 months to 12 Mar 2026 (appendix); 740,000,000 shares since the 1-for-1 bonus issue of May 2023, no treasury shares (1H2026 results).
- Debt: no bank borrowings; lease liabilities S$3.7m at 30 Jun 2026 (1H2026 results).
- M&A and expansion: no acquisitions found; growth comes from recruiting more agents and from industrial property (Business Times).
3. Financial Health
| S$m | FY2021 | FY2022 | FY2023 | FY2024 | FY2025 | 1H2026 |
|---|---|---|---|---|---|---|
| Revenue | 957.5 | 1,029.2 | 838.1 | 783.0 | 1,116.4 | 603.0 |
| Gross profit | 101.8 | 104.7 | 81.0 | 71.0 | 115.0 | 63.9 |
| Profit before tax | 78.7 | 79.1 | 59.5 | 49.8 | 89.7 | 52.2 |
| PATMI | 60.0 | 62.4 | 47.8 | 40.9 | 70.4 | 40.9 |
| EPS (cents) | 8.11 | 8.43 | 6.46 | 5.53 | 9.51 | 5.53 |
| Dividend (cents) | 6.25 | 6.75 | 6.00 | 7.75 | 9.50 | 5.00 |
| Operating cash flow | 83.1 | 51.4 | 58.3 | 38.0 | 91.2 | 33.2 |
| Cash | 145.7 | 138.9 | 133.4 | 111.8 | 149.1 | 130.2 |
Sources: FY2022 release, FY2024 release, FY2025 results, 1H2026 results, Annual Report 2025, stockanalysis income statement (FY2023 PBT) and cash flow (FY2021–FY2023 operating cash flow) and balance sheet (FY2021–FY2023 cash). Per-share figures are restated for the 2023 bonus issue. FY2024 dividend is 7.75c as declared (stockanalysis shows 5.2c).
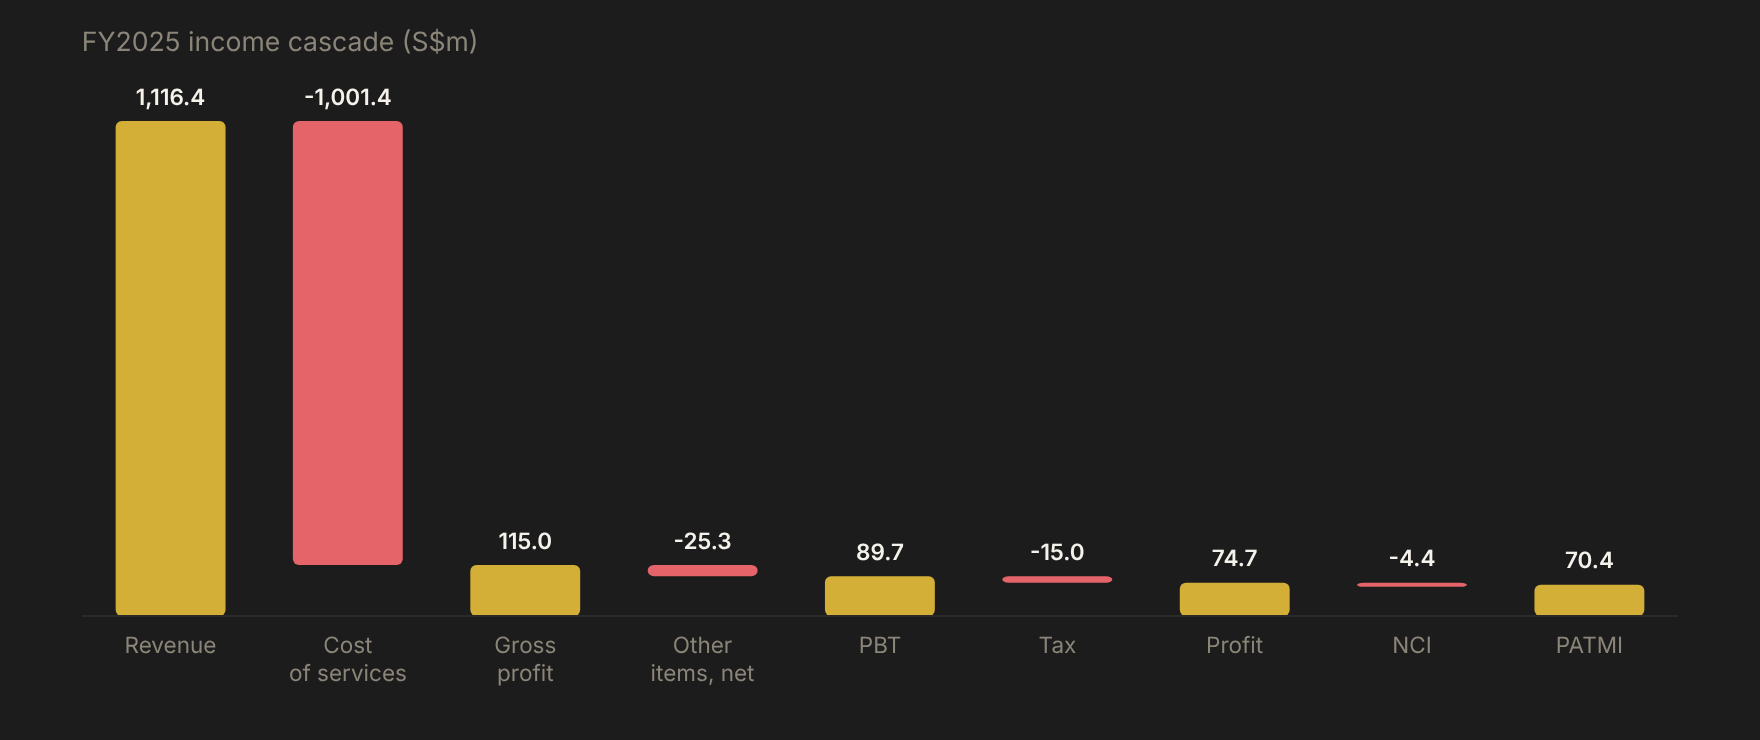
- Cash backs the profit: FY2025 operating cash flow S$91.2m vs PATMI S$70.4m; capex just S$0.4m.
- Thin margin, high leverage to volume: gross margin was 10.3% in FY2025; a 10% fall in revenue at a similar cost base would hit profit far harder.
- 1H2026 softer: gross profit fell 3.5% and operating cash flow fell to S$33.2m (S$45.3m in 1H2025); higher bad-debt write-offs were cited on results day (Tiger Brokers).
- Cash is mostly paid out: dividends paid were S$80.8m in FY2025; cash fell from S$149.1m to S$130.2m in 1H2026 while other investments rose to S$31.3m.
4. Risks
Macro & Regulatory
- Serious: New-launch volumes — developers sold only 153 new homes in August 2026 (no launches) (Stacked Homes) and 1H2026 project-marketing revenue fell 7.8%; fewer launches cut the highest-value commissions.
- Watch: Cooling measures — seller’s stamp duty was extended to four years in July 2025 (MOF); the government eased the HDB wait-out rule in July 2026, showing policy can move either way.
- Watch: Interest rates — 3-month SORA was about 1.19% in September 2026 (propertynet); a rise would cool transactions.
Operational & Competitive
- Serious: Agent dependence — salespersons keep about 90% of commissions and can move to rivals; growth depends on recruiting more agents.
- Watch: Conduct and litigation — PropNex had 28 CEA enforcement actions in 2025 (EdgeProp); several suits against its subsidiary have been withdrawn without cost.
- Watch: Competition for project-marketing mandates from ERA, Huttons and OrangeTee.
Financial & Governance
- Watch: Payout above policy — 99.9% in FY2025 and 140.1% in FY2024 leaves little buffer if earnings fall.
- Watch: Concentrated control — founders control well over half the shares, which limits free float and trading liquidity.
- Watch: Board turnover — four independent-director changes between Nov 2025 and Jul 2026 (two appointments, one resignation, one retirement).
5. Catalysts
| When | Measurable test | Odds |
|---|---|---|
| Mid-Oct 2026 | URA developers’ sales for September 2026 above 1,000 units | 50% |
| 4Q2026 | 2H2026 launches broadly on plan (13 projects / 4,222 units per PropNex) | 55% |
| Late Feb 2027 (FY2026 results) | FY2026 PATMI ≥ S$72m (2H2026 ≥ S$31m vs S$28.1m in 2H2025) | 45% |
| Late Feb 2027 | Salespersons ≥ 15,000 reported | 60% |
Bull vs consensus: 8 analysts, consensus BUY, average target S$2.14 (range S$1.77–2.55) (MarketScreener, stockanalysis); FY2026 revenue S$1.14bn and EPS about S$0.10. Recent targets: iFAST S$2.70 (14 Aug 2026), Phillip S$2.08 (21 Aug), Beansprout S$1.94 (22 Aug). Our bull case (S$1.60) needs FY2027 revenue +8% and a 7.0% net margin — still below the price because we discount at 9.6%.
6. Valuation Suite
6a. Cost of Capital
| Input | Value | Source / note |
|---|---|---|
| Risk-free (Singapore 10-year SGS, 6 Oct 2026) | 2.50% | Beansprout (MAS SGS benchmark) |
| Own 2-yr weekly beta vs STI | 0.63 | IBKR weekly closes, 104 weekly returns to 6 Oct 2026; SPDR STI ETF (ES3) as the index proxy |
| Peer median beta (check) | 1.44 | stockanalysis 5-year betas of the 6 peers in 6d |
| Raw beta used | 1.03 | Average of the two (gap > 0.3), per method |
| Adjusted beta (0.67×raw+0.33) | 1.02 | |
| Equity risk premium | 5.0% | Developed market (assumption) |
| Size/illiquidity premium | 2.0% | S$1.3bn market value; about S$0.86m a day traded (IBKR, last 63 sessions); founders hold most shares |
| Cost of equity | 9.6% | Used in DCF, residual income and peer discounting |
| Debt weight / after-tax cost of debt | 0% / n/a | No bank borrowings; leases S$3.7m ignored |
| WACC | 9.6% | Equals cost of equity (no debt) |
6b. Discounted Cash Flow (DCF)
| S$m | FY26E | FY27E | FY28E | FY29E | FY30E |
|---|---|---|---|---|---|
| Revenue | 1,137.4 | 1,177.1 | 1,212.4 | 1,248.8 | 1,280.0 |
| Growth | +1.9% | +3.5% | +3.0% | +3.0% | +2.5% |
| PATMI | 72.8 | 75.5 | 77.8 | 80.1 | 82.1 |
| Net margin | 6.4% | 6.4% | 6.4% | 6.4% | 6.4% |
| Free cash flow to equity | 30.3* | 71.7 | 73.9 | 76.1 | 78.0 |
| Present value | 29.6 | 64.0 | 60.1 | 56.5 | 52.8 |
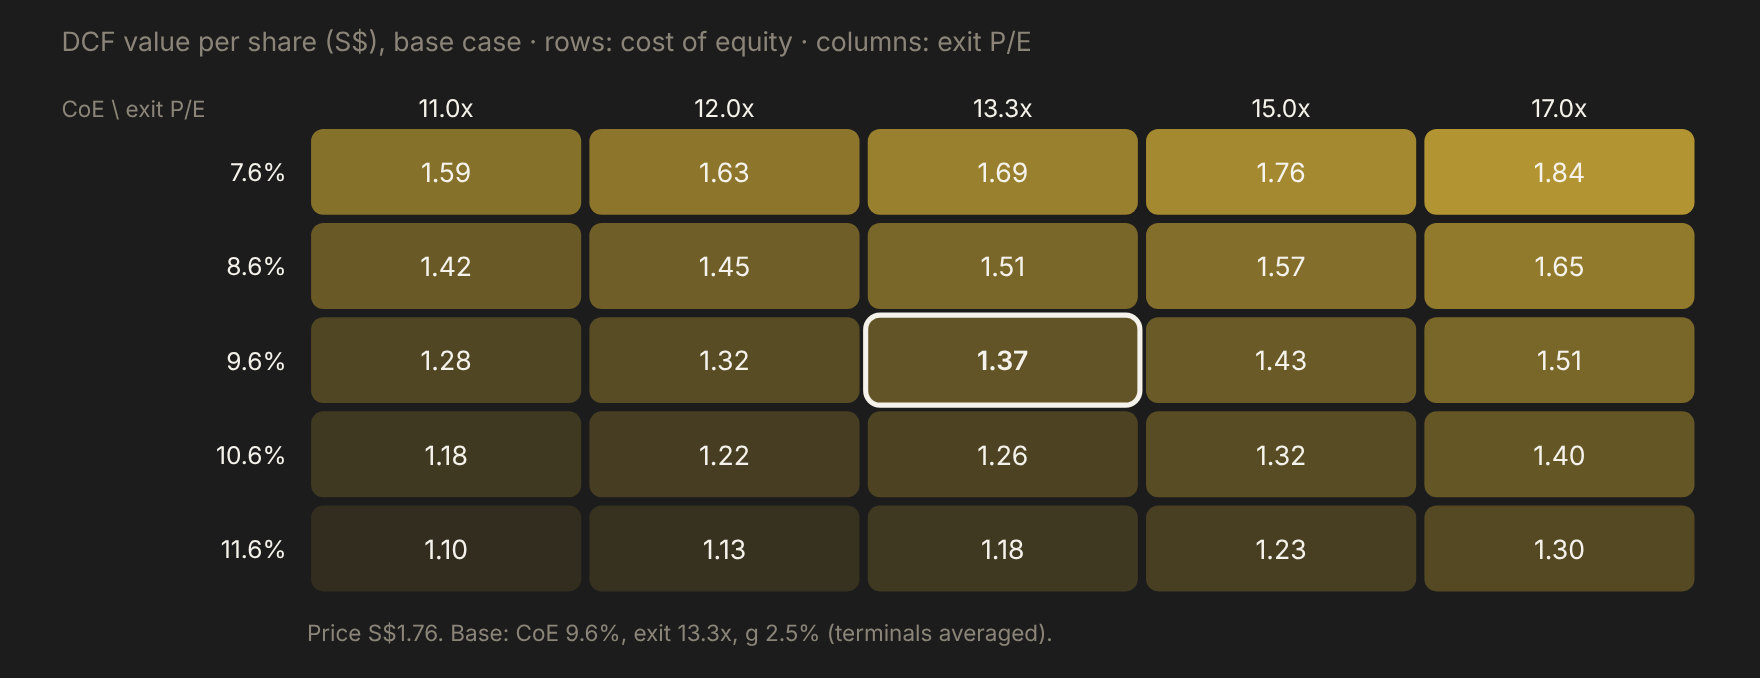
Asset-light company with no debt, so free cash flow to equity = free cash flow to the firm, valued at the 9.6% cost of equity: FCFE = PATMI × (1 − 5% reinvestment; assumption — capex was S$0.4m in FY2025). Year 1 = FY2026 consensus (revenue +1.9%, EPS +3.5%); *only 2H2026 is counted (FY2026 PATMI less the S$40.9m earned in 1H2026). Year 2 = FY2027 consensus (revenue +3.5%, EPS +3.7%); then +3.0%, +3.0% and +2.5% with the margin held. Terminal: perpetuity growth 2.5% (assumption, below Singapore long-run nominal growth) and an exit P/E equal to the peer median (13.3x), averaged. 740.0m shares; the S$130.2m cash is not added separately because its interest income is already in PATMI.
| Case | Key differences | Perpetuity (g) | Exit multiple | DCF value |
|---|---|---|---|---|
| Bear | FY27 revenue -10%, FY28 -3%, then +2%; net margin 5.5% | S$0.88 (g 1.5%) | S$0.84 (11x) | S$0.86 |
| Base | Consensus FY26–27, then +3/+3/+2.5%; margin 6.4% | S$1.38 (g 2.5%) | S$1.36 (13.3x) | S$1.37 |
| Bull | FY27 +8%, FY28 +6%, then +4/+3%; net margin 7.0% | S$1.73 (g 3.0%) | S$1.84 (16x) | S$1.79 |
Implied discount rate: the base-case cash flows equal today’s S$1.76 price at 7.3%, versus our 9.6% WACC.
6c. Residual Income
| S$m | 2H26E | FY27E | FY28E | FY29E | FY30E |
|---|---|---|---|---|---|
| Opening book | 123.8 | 125.4 | 129.1 | 133.0 | 137.0 |
| PATMI | 31.9 | 75.5 | 77.8 | 80.1 | 82.1 |
| ROE (period) | 25.8% | 60.2% | 60.2% | 60.2% | 59.9% |
| Residual income | 26.0 | 63.5 | 65.4 | 67.3 | 69.0 |
Starting book value S$123.8m (owners’ equity at 30 Jun 2026; NAV 16.73c a share), 95% payout, cost of equity 9.6%. Value with full persistence S$1.39 a share; with 50% persistence S$0.53; average S$0.96. Justified P/B = (ROE − g)/(CoE − g) = 8.2x at a 61% ROE. Shown for reference only (0% weight) — asset-light, P/B above 10x.
6d. Peers (Stockanalysis, Prices at 25 Aug–6 Oct 2026)
| Ticker | Price | Mkt cap | Fwd P/E | EV/EBITDA | 3-yr growth fcst |
|---|---|---|---|---|---|
| OYY (PropNex) | S$1.76 | S$1.30bn | 17.9 | 15.6 | NOT FOUND (EPS +3.5% / +3.7% FY26/27) |
| CLN (APAC Realty) | S$0.575 | S$247.9m | 12.43 | 8.28 | NOT FOUND |
| BEKE (KE Holdings) | US$16.77 | US$19.16bn | 14.24 | 16.57 | NOT FOUND |
| COMP (Compass) | US$9.02 | US$6.83bn | 108.99 | 29.62 | NOT FOUND |
| 1200.HK (Midland) | HK$2.27 | HK$1.68bn | 3.27 | 1.23 | NOT FOUND |
| DOUG (Douglas Elliman)* | US$1.68 | US$152.7m | n/a | n/a | NOT FOUND |
| AGNT (ex-eXp World)* | US$3.82 | US$638.4m | n/m (loss) | n/m | NOT FOUND |
| Peer median (ex OYY) | 13.3 | 12.4 |
Peer method: median forward P/E of the four peers with positive forward earnings (CLN, BEKE, COMP, Midland: 13.3x) × FY2027 EPS of 10.2 cents (consensus path) = S$1.36 at end-2027, discounted one year at the 9.6% cost of equity = S$1.24. Cross-check: peer median EV/EBITDA 12.4x vs PropNex 15.6x (stockanalysis). *DOUG has no forward P/E and AGNT is loss-making, so neither is in the median; OYY row: price IBKR 6 Oct 2026, EV/EBITDA stockanalysis at S$1.78 (21 Sep). Peer prices: CLN 9 Sep, BEKE 6 Oct, COMP 29 Sep, Midland 25 Aug, DOUG 15 Sep, AGNT 6 Oct 2026.
6e. Single-lever Test
| Input changed alone | Low | High | Swing |
|---|---|---|---|
| Net margin ×0.85 / ×1.15 from FY2027 | S$1.11 | S$1.50 | S$0.39 |
| Peer P/E 11x / 16x (peer leg and exit multiple) | S$1.15 | S$1.48 | S$0.33 |
| Size premium 3% / 0% (cost of equity 10.6% / 7.6%) | S$1.25 | S$1.48 | S$0.23 |
| Raw beta: peer median 1.44 / own 0.63 (cost of equity 11.0% / 8.2%) | S$1.23 | S$1.41 | S$0.18 |
| Terminal growth 1.5% / 3.5% | S$1.27 | S$1.35 | S$0.08 |
The biggest lever is the net margin: a ±15% change in margins from FY2027 moves fair value from S$1.11 to S$1.50. Even the high end is below the price. Values are fair value (50/50) with only that input changed.
7. Synthesis
| Method | Inputs | Value | vs price | Weight | Weighted |
|---|---|---|---|---|---|
| DCF (FCFE = FCFF) | CoE 9.6%, g 2.5%, exit 13.3x | S$1.37 | -22.1% | 50% | S$0.69 |
| Residual income | Book S$123.8m, ROE ~60% | S$0.96 | -45.4% | 0% | — |
| Peers | 13.3x × FY27 EPS S$0.102 | S$1.24 | -29.5% | 50% | S$0.62 |
| Fair value | S$1.31 | ||||
| Bear / Base / Bull | DCF cases; peers on bear / consensus / bull FY27 EPS | S$0.89 / S$1.31 / S$1.60 | -49.3% / -25.8% / -9.1% |
How much rests on consensus: the peer value uses consensus-path FY2027 EPS of 10.2 cents. On our bear-case FY2027 (revenue -10%, EPS about 7.6 cents) the peer value falls to S$0.93 and the blended fair value to S$1.15 (-34.8% vs price).
Margin of safety: none — the price is 34.7% above our fair value. A 30% margin of safety would mean a price of about S$0.91. The implied discount rate of 7.3% vs our 9.6% cost of equity is the gap: investors are pricing PropNex like a bond-proxy dividend stock.
8. Technicals
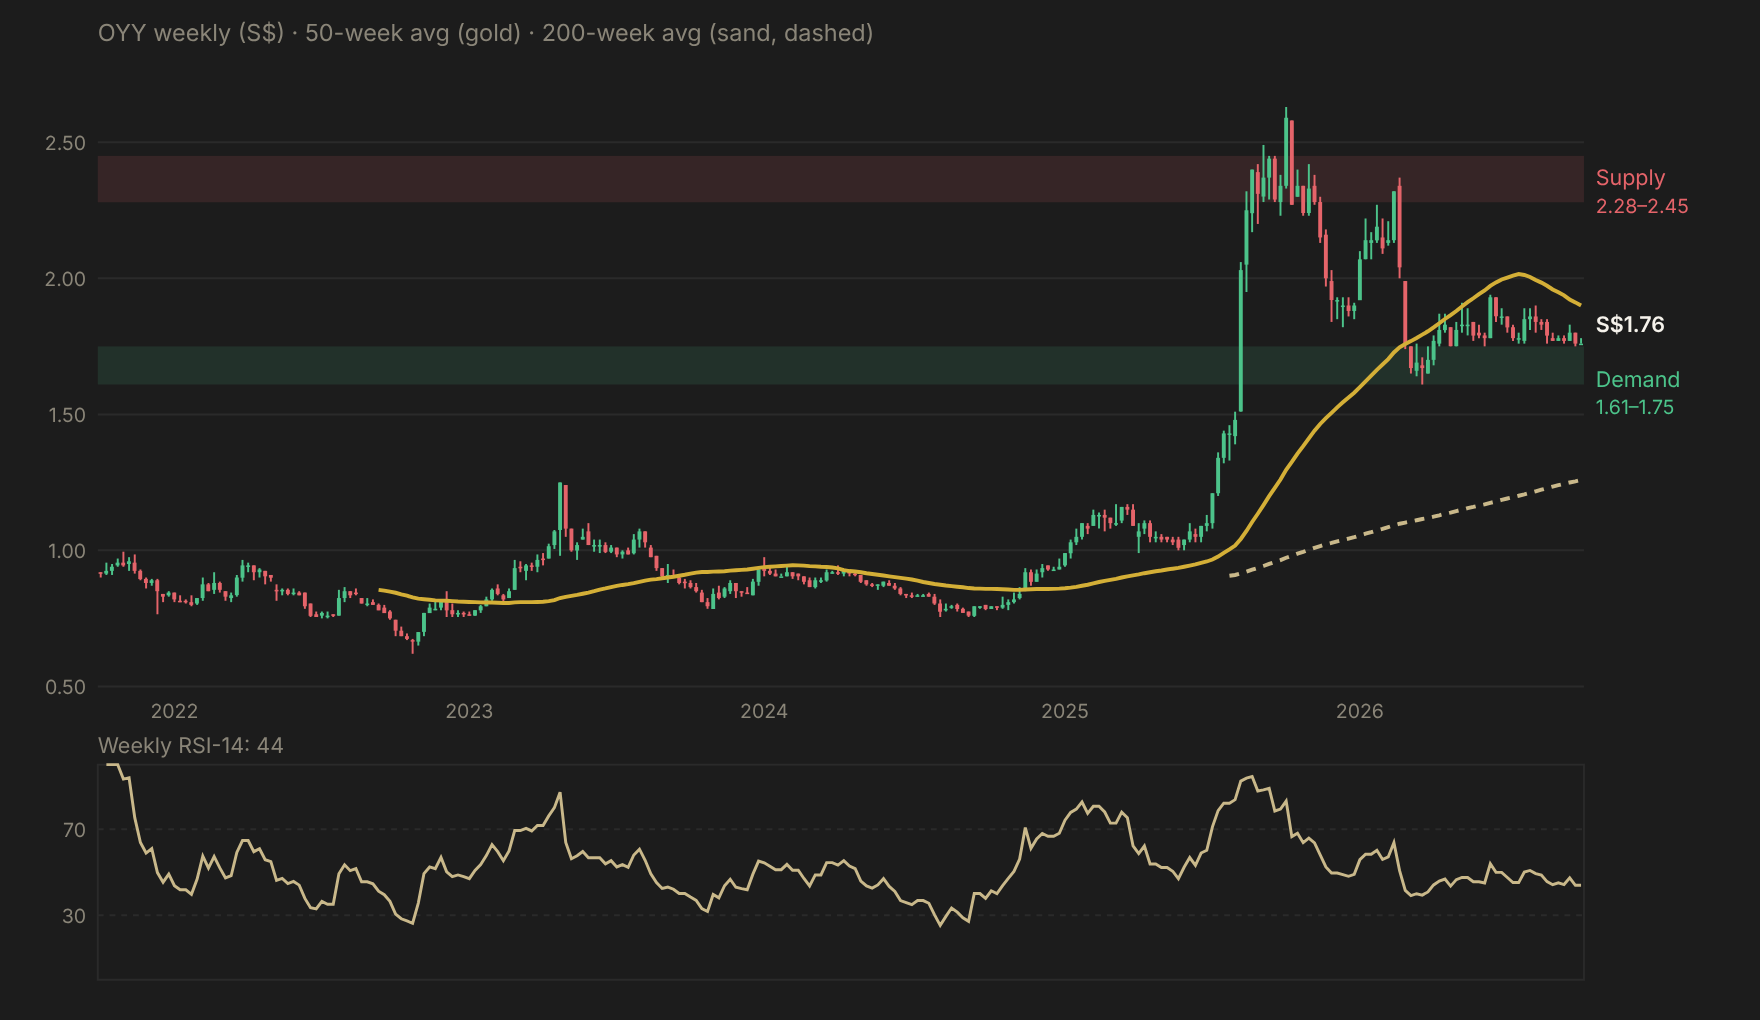
Trend: sideways to down. The price (S$1.76) is below the 50-day (S$1.80), 100-day (S$1.81) and 200-day (S$1.87) averages, and the 50-day is below the 200-day; on the weekly chart it is below the 50-week (S$1.90) but well above the 200-week (S$1.26). Momentum: daily RSI 41 and weekly RSI 44 — soft, not oversold; the daily MACD histogram is about zero (-0.0005 vs +0.0016 a week ago). Volatility: 20-day average true range S$0.021 (about 1.2% of the price). Volume: trading has dried up — 20-day average 0.25m shares vs 0.47m over 63 sessions; the heaviest one-year volume-by-price zone is S$1.80–1.85.
| Level | Price | Basis |
|---|---|---|
| Resistance 2 | S$2.28–2.45 | Supply band: Oct 2025 and Feb 2026 congestion |
| Resistance 1 | S$1.87–1.94 | 200-day average; 2026 rebound high S$1.94 (19 Jun 2026) |
| Current | S$1.76 | 6 Oct 2026 close |
| Support 1 | S$1.75 | Lows of the past three months |
| Support 2 | S$1.61 | 52-week low (23 Mar 2026) |
Our Dated Calls
Pre-registered; scored on the dates shown. Price calls use total return after ~0.1% trading costs.
| # | Call | Probability | Scoring date |
|---|---|---|---|
| 1 | FY2026 PATMI ≥ S$72m | 45% | 1 Mar 2027 |
| 2 | FY2026 total dividend ≥ 9.5 cents | 55% | 1 Mar 2027 |
| 3 | Salespersons ≥ 15,000 in the FY2026 results release | 60% | 1 Mar 2027 |
| 4 | URA: 2026 developers’ new private home sales (ex-EC) ≥ 9,000 units | 45% | 15 Feb 2027 |
| 5 | OYY total return from S$1.76 is negative after costs | 45% | 7 Apr 2027 |
| 6 | OYY closes below S$1.55 at least once | 30% | 7 Apr 2027 |
Bull Case
- Phillip Securities sees potentially about 11,000 units launching in 2027, against 13 projects / 4,222 units planned for 2H2026 — project marketing could rebound.
- Market share keeps rising (64.3% of transactions with 38.1% of agents) and the agent force grew to 14,574 by 3 Aug 2026 from 13,945 on 1 Jan 2026.
- A 5.4% yield, no debt and a 60% ROE make it a favourite of income investors.
Bear Case
- At 17.9x earnings the price needs a 7.3% discount rate on our base case — low for a cyclical commission business.
- 1H2026 PATMI fell 3.1% and August 2026 new-home sales were just 153 units.
- Payout is already about 100% of profit, so dividends cannot grow faster than earnings.
FAQ
What is PropNex’s fair value?
Our 12-month fair value is S$1.31 per share (range S$0.89–S$1.60), from 50% DCF (S$1.37) and 50% peers (S$1.24), -25.8% vs the S$1.76 close on 6 Oct 2026.
Is PropNex undervalued?
No — on our numbers it looks overvalued. The price implies a 7.3% discount rate on our base-case cash flows, versus our 9.6% cost of equity.
What are the main risks for PropNex?
Fewer new launches (project-marketing revenue fell 7.8% in 1H2026), dependence on agents who keep about 90% of commissions, property cooling measures and a payout already near 100% of profit.
When are PropNex’s next results?
FY2026 results are expected in late February 2027 (not yet announced); PropNex reports half-yearly and released FY2025 results on 26–27 Feb 2026.
Does PropNex pay a dividend?
Yes — 9.5 cents in the last 12 months (4.5c final FY2025 paid 8 May 2026, 5.0c interim 1H2026 paid 11 Sep 2026), a 5.4% yield at S$1.76. Stated policy is 75%–80% of PATMI.
Method and Sources
Asset-light company valuation: FCFE DCF at the cost of equity (perpetuity-growth and exit-P/E terminals averaged; equal to FCFF as there is no debt) and a peer forward-P/E value on FY2027 EPS, weighted 50/50. Residual income is shown for reference only (0% weight) because P/B is above 10x. One cost of equity (9.6%) is used throughout. Prices are IBKR SGX closes to 6 Oct 2026. Consensus is stockanalysis (S&P Global, 8 analysts) cross-checked with MarketScreener. Figures independently fact-checked against the linked sources on 7 Oct 2026.
- Prices, beta, technicals: Interactive Brokers market data (OYY @SGX; ES3 as STI proxy).
- FY2025 results · 1H2026 results · 1H2026 press release · 1H2026 business update · Annual Report 2025 · Buy-back mandate appendix · FY2024 release · FY2022 release · Interim dividend notice · CEO appointment · Board composition
- Consensus and statistics: stockanalysis forecast · stockanalysis statistics · financials · cash flow · dividends · MarketScreener consensus · MarketScreener news
- Brokers and news: Phillip Securities · iFAST via minichart · Beansprout · EdgeProp FY2025 · EdgeProp 1H2026 · Business Times via redhot · EdgeProp CGO · TipRanks · Tiger · minichart · Tiger results day · EdgeProp CEA
- Market and rates: URA 3Q2026 flash · Stacked Homes Aug sales · The Star · MOF SSD · propertynet SORA · SGS 10-year
Not located (NOT FOUND): insider dealings in the last 12 months; directors’ remuneration; FY2027 consensus EPS detail beyond the stockanalysis summary; 2026 targets from DBS, UOB Kay Hian, Maybank, CGS and OCBC; an announced FY2026 results date; peer 3-year growth forecasts; Singapore long-run nominal GDP (terminal growth of 2.5% is an assumption); any material single customer.
Analysis only, not a recommendation to buy or sell any security. Figures as at 6 Oct 2026; sources linked. The author holds a position in OYY.
Get the next report by email
One independent, fact-checked equity research report each weekday on Singapore and US stocks, with every prediction scored in public. Free.


Leave a comment