
Download the full report (PDF)
Snapshot
| Item | Value |
|---|---|
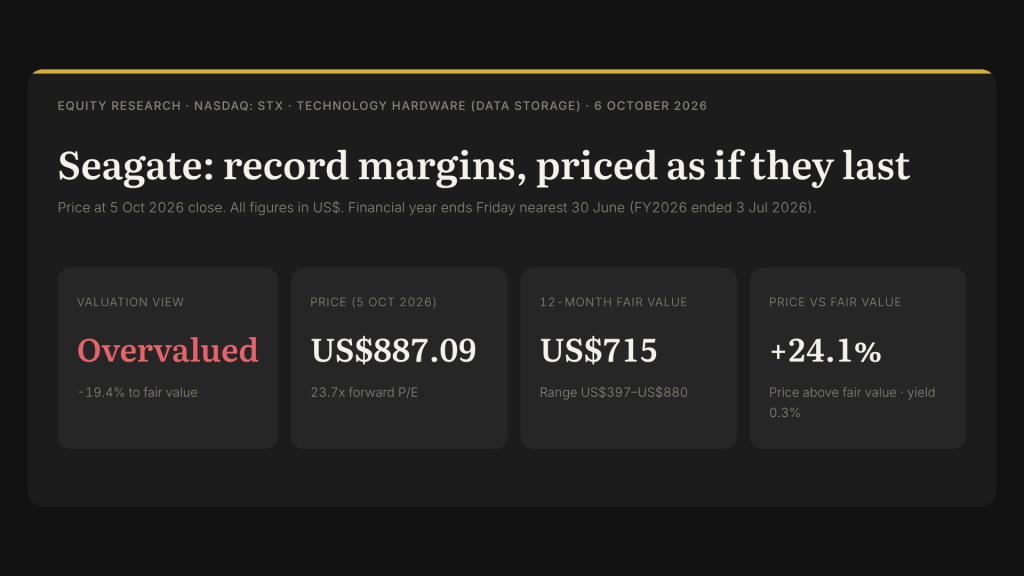
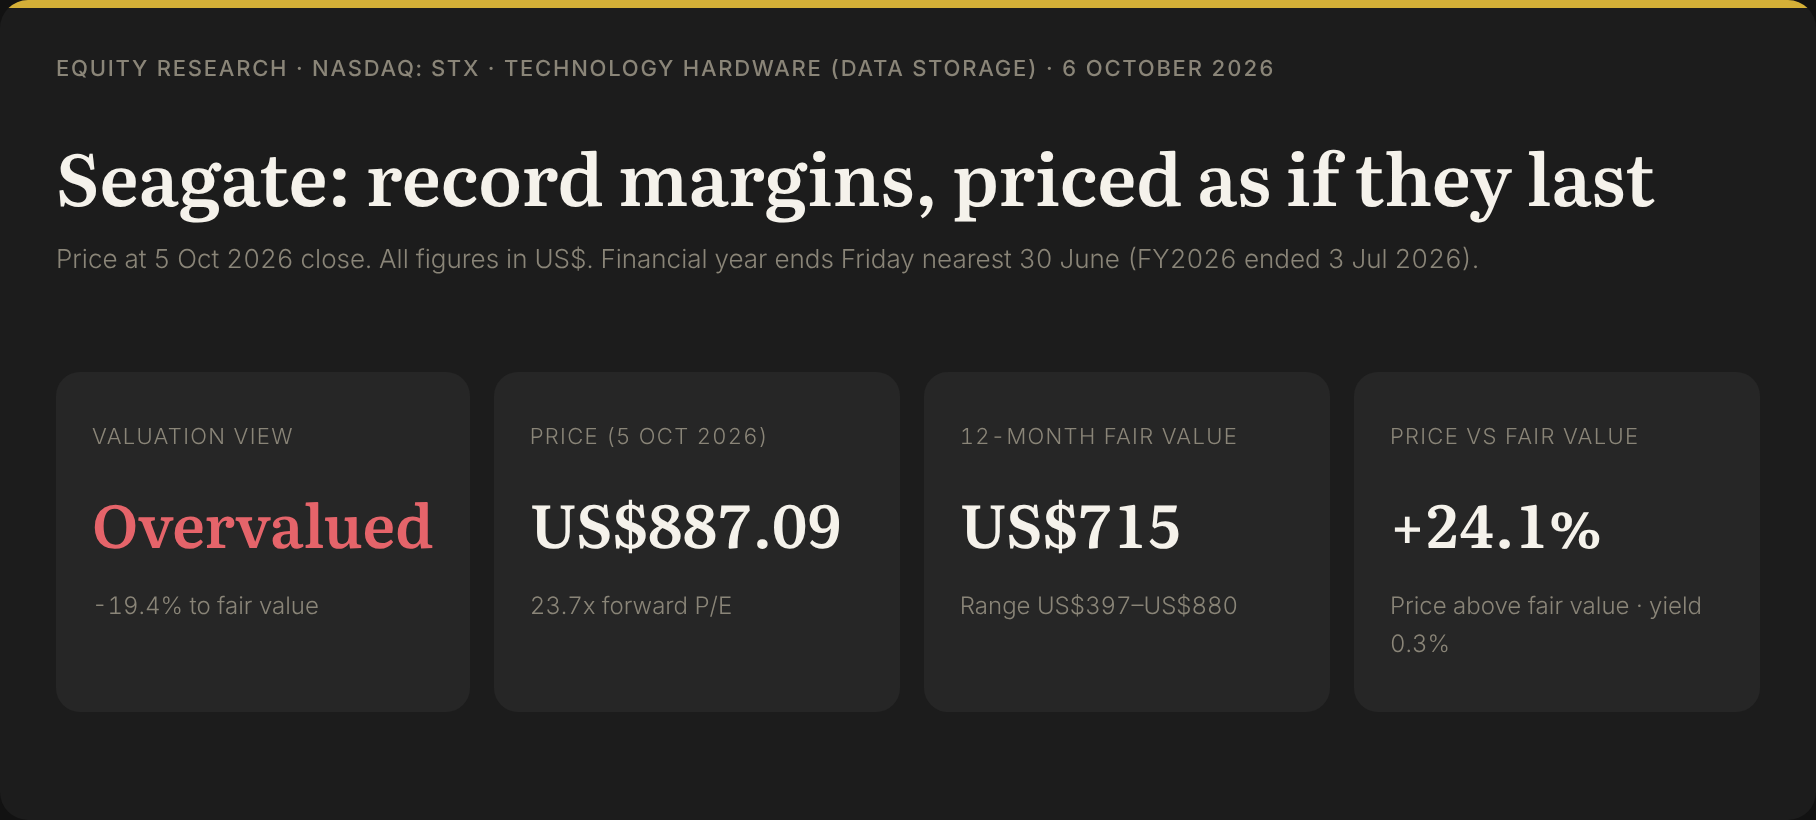
| Valuation view | Overvalued (-19.4% to fair value) |
| Current price | US$887.09 (5 Oct 2026 close; 23.7x forward P/E) |
| 12-month fair value | US$715 (50% DCF / 50% peers) |
| Bear–bull range | US$397 (-55.3%) to US$880 (-0.7%) |
| Dividend yield | 0.3% (US$0.74 a quarter) |
Key Takeaways
- Overvalued: our fair value is US$715 vs US$887.09 (-19.4%), with a range of US$397–US$880; even our bull case sits -0.7% from the price.
- Boom-time results: FQ4 FY26 revenue US$3,629m (+48% y/y), non-GAAP gross margin 52.7% and non-GAAP EPS US$5.71; guidance for FQ1 FY27 is US$4.1bn ± US$0.1bn revenue and US$7.30 ± US$0.20 EPS (Seagate FQ4 FY26 release).
- The price assumes the shortage lasts: our base-case cash flows only equal the price at a 5.4% discount rate, versus our 13.0% WACC; how long margins stay near 50% decides the value.
The Verdict
Overvalued — fair value US$715 (range US$397–US$880), -19.4% vs US$887.09 (5 Oct 2026 close).
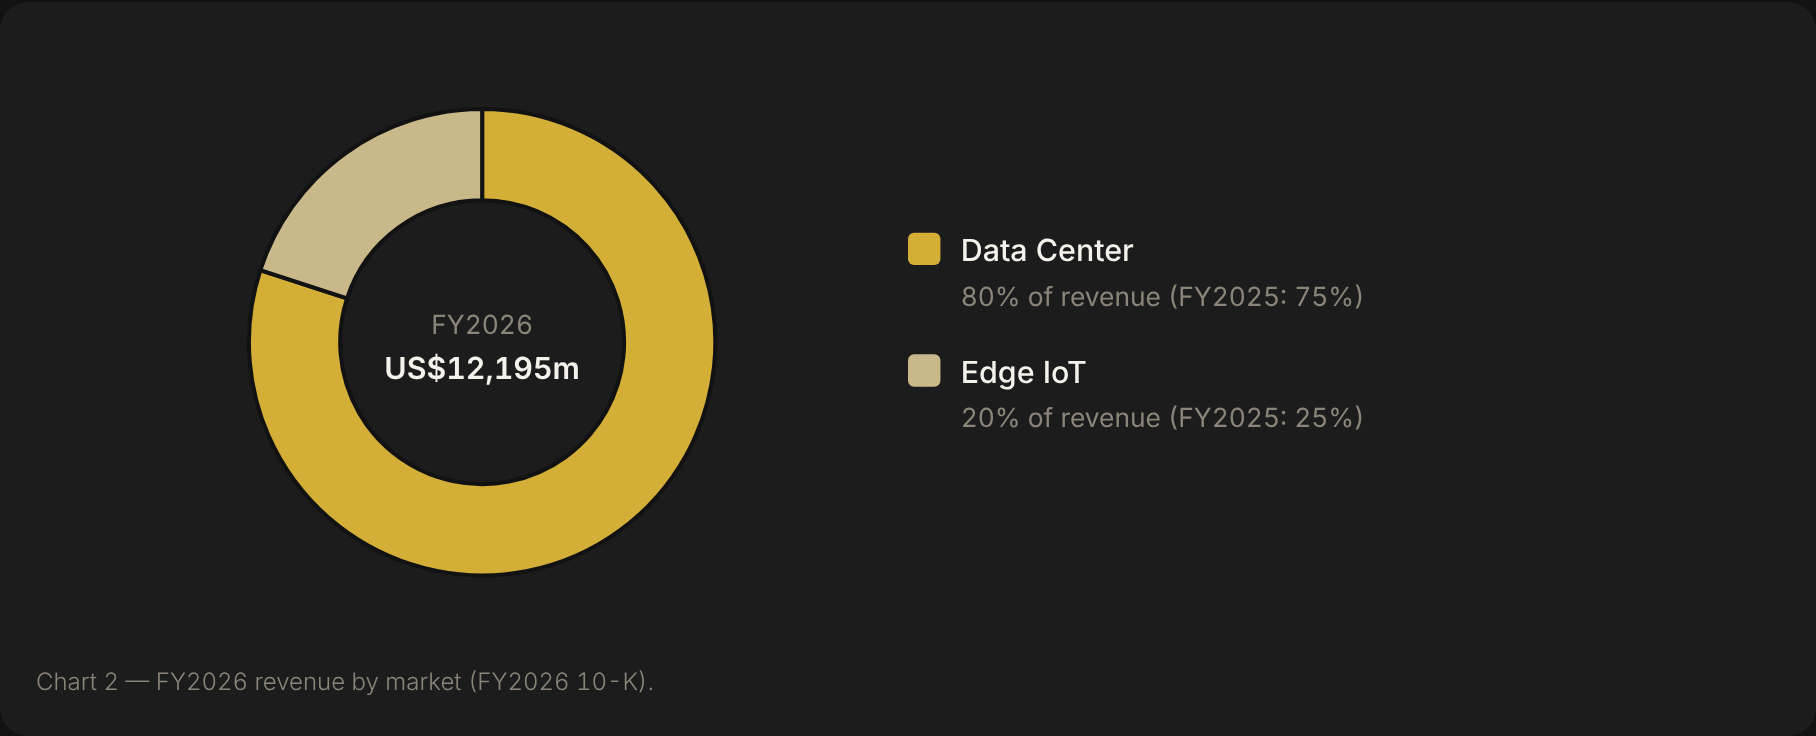
What is working: Seagate is in the strongest stretch in its recent history. FY2026 (to 3 Jul 2026) revenue rose 34% to US$12,195m, non-GAAP EPS reached US$15.58 and free cash flow a record US$3,105m; data-centre drives were 80% of revenue (FY26 10-K, stockanalysis). Quarterly non-GAAP gross margin climbed from 40.1% (FQ1) to 52.7% (FQ4), 44TB Mozaic 4+ HAMR drives are in production with hyperscalers (Blocks & Files), and Moody’s upgraded the company to Ba1 on 28 Aug 2026 (investing.com).
What the price already assumes: the shares are up 222% this year (from US$275.39 at 31 Dec 2025) and sit 22.5% below the 52-week high of US$1,145.00 (mid-June 2026). At US$887.09 the stock trades on 23.7x forward earnings and 45.5x trailing EV/EBITDA (stockanalysis). On our base case — consensus revenue of US$18.8bn for FY2027 and US$26.0bn for FY2028, then margins fading from 52% to 35% by FY2031 — the price is justified only at a 5.4% discount rate, far below our 13.0% WACC. Put plainly, the market is paying for peak margins to last for years, not quarters.
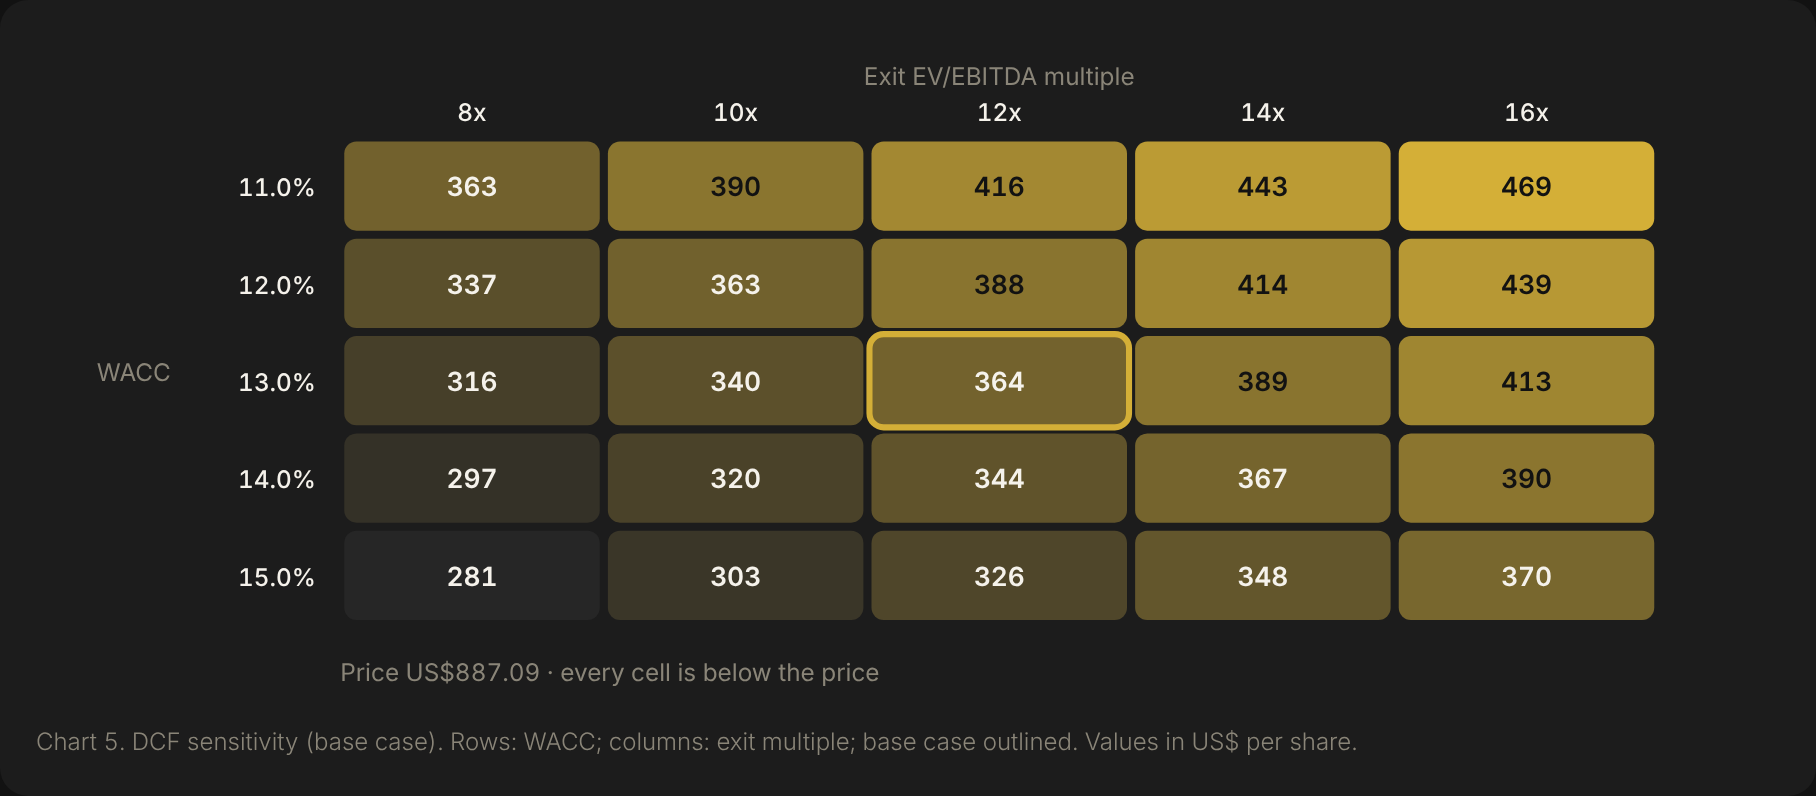
The single factor that decides it: how long the hard-drive shortage keeps operating margins near 50%. Toshiba said on 2 Oct 2026 it will double its hard-drive output by FY2027, which knocked the stock 10.2% in a day (Benzinga). If supply stays tight and margins hold at 52% through FY2031, our DCF rises from US$364 to US$501; if they fade to 25%, it falls to US$281.
Recent Developments (last 12 months)
| Date | Event | Why it matters |
|---|---|---|
| 28 Oct 2025 | FQ1 FY26: revenue US$2.63bn, non-GAAP EPS US$2.61, non-GAAP GM 40.1%; dividend raised to US$0.74 from US$0.72 (Seagate) | Start of the margin up-cycle |
| 22 Dec 2025 | Added to the Nasdaq-100 (MarketScreener) | Broader index ownership |
| 27 Jan 2026 | FQ2 FY26: revenue US$2.83bn, non-GAAP EPS US$3.11, GM 42.2%; US$500m exchangeable notes retired (Seagate) | Deleveraging continues |
| 4 Mar 2026 | Mozaic 4+ HAMR: 44TB drives; two hyperscalers in production; long-term agreements through CY2027 (Blocks & Files) | Capacity lead and visibility |
| 28 Apr 2026 | FQ3 FY26: revenue US$3.11bn, non-GAAP EPS US$4.10, GM 47.0%, FCF US$953m (Seagate) | Margin step-up |
| 1 Jun 2026 | Securities class action settled for US$175m, subject to court approval; ~US$70m from insurers (Claims Journal) | Legal overhang mostly reserved |
| 29 Jul 2026 | FQ4 FY26: revenue US$3,629m (+48%), non-GAAP EPS US$5.71, GM 52.7%; FQ1 FY27 guide US$4.1bn / US$7.30; US$0.74 dividend (Seagate) | Record quarter and higher guide |
| 15 Jul / 8 Sep 2026 | US$1bn senior notes redeemed; remaining 2028 exchangeable notes (US$185m per the 10-K) called for 8 Sep 2026, excess settled in shares (10-K) | Lower debt, small dilution |
| 28 Aug 2026 | Moody’s upgrades to Ba1, outlook stable (investing.com) | Cheaper funding |
| 8 Sep 2026 | Proxy: AGM 24 Oct 2026; board cut from 11 to 9 directors; Mark Adams lead independent director (DEF 14A) | Governance change |
| 16 Sep 2026 | CFO Gianluca Romano sold 49,983 shares for US$38.6m (Benzinga) | Part of steady insider selling |
| 30 Sep 2026 | Zacks Research cuts to Hold from Strong Buy (ad-hoc-news) | First notable downgrade |
| 2 Oct 2026 | Toshiba to double HDD output by FY2027 (~US$380m Philippines plant); STX closes -10.21% at US$848.99 (Benzinga, StartupFortune) | Supply response — the key risk |
| 5 Oct 2026 | Rebound +4.5% to US$887.09; Bernstein calls the sell-off “a storm in a teacup”; Rosenblatt target US$1,400 (24/7 Wall St, stockanalysis) | Sell side defends the cycle |
| 27 Oct 2026 (expected) | Next: FQ1 FY27 results (stockanalysis; not confirmed by Seagate) (stockanalysis) | Test of the US$4.1bn guide |
Key Numbers
| Metric | Value | Basis |
|---|---|---|
| Forward P/E | 23.7x | stockanalysis forward P/E, 5 Oct 2026; 24.8x on FY2027 consensus EPS US$35.78 |
| P/B | 93.1x | Book US$2,167m (3 Jul 2026) ÷ 227.39m shares |
| Revenue growth | +48% / +34% | FQ4 FY26 y/y / FY2026 |
| WACC | 13.0% | Cost of equity 13.1% (UST 10y 5.24% + β 1.57 × 5%) |
| Non-GAAP gross margin | 52.7% | FQ4 FY26 (37.9% a year earlier) |
| From 52-week high | -22.5% | 52-week range US$209.00–1,145.00 |
1. Business & Moat
Seagate Technology Holdings plc is incorporated in Ireland with its principal executive offices in Singapore. It makes hard-disk drives (HDDs) and related storage; in FY2026 it shipped 789 exabytes, 695 of them nearline (data-centre) capacity, up from 595 exabytes a year earlier (FY26 10-K). The company now reports by market rather than by product.
| Split (FY2026) | Revenue share | FY2025 |
|---|---|---|
| Data Center | 80% | 75% |
| Edge IoT | 20% | 25% |
| OEM channel | 81% (US$9,819m) | 80% |
| Distributors | 13% (US$1,638m) | 12% |
| Retail | 6% (US$738m) | 8% |
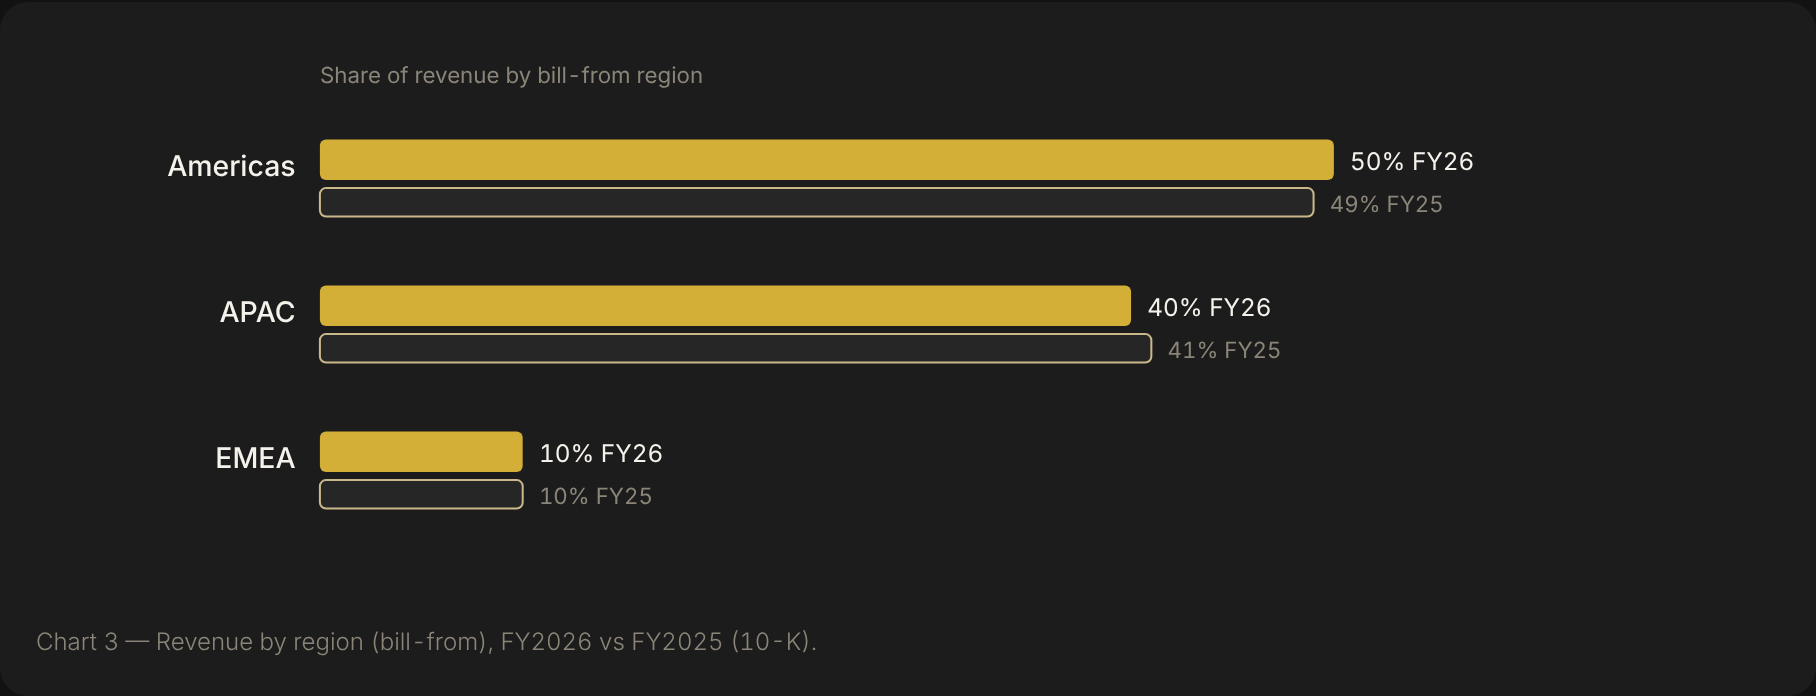
Source: FY2026 10-K. One customer was about 14% of FY2026 revenue (about 10% in FY2025). Revenue by country (bill-from): United States US$6,146m, Singapore US$4,880m, Netherlands US$1,165m.
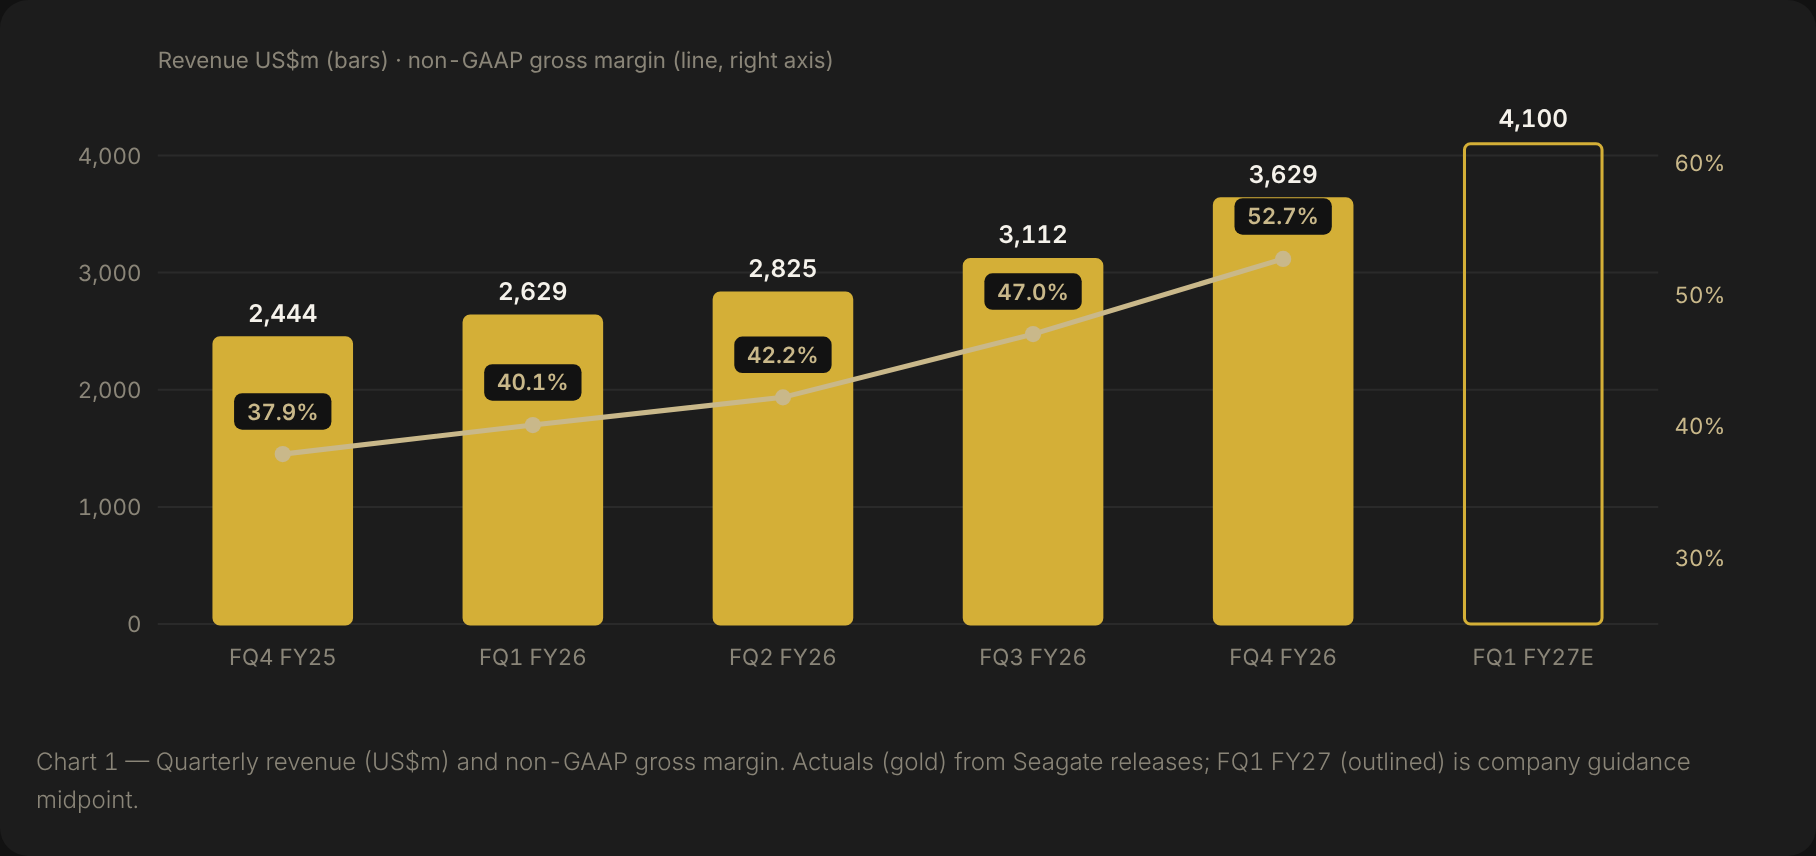
Guidance (29 Jul 2026): FQ1 FY27 revenue US$4.1bn ± US$0.1bn and non-GAAP EPS US$7.30 ± US$0.20 (Seagate). Full-year FY2027 guidance: NOT FOUND (the company guides one quarter ahead).
Porter’s Five Forces
| Force | Pressure | Comment |
|---|---|---|
| Rivalry | Medium, rising | Western Digital and Toshiba are the other HDD makers; Toshiba plans to double output by FY2027 |
| New entrants | Low | HAMR recording and drive manufacturing take years and heavy capital to replicate |
| Substitutes | Medium | Flash (Sandisk, Micron) competes for some data-centre storage as SSD prices move |
| Buyer power | High | OEMs are 81% of revenue and one customer ~14%; hyperscalers negotiate long-term agreements |
| Supplier power | Low–medium | Not quantified in sources found (NOT FOUND) |
Moat verdict: narrow, cyclical. Seagate has a technology lead in areal density (44TB HAMR in production) inside a three-player industry, but it sells to a handful of very large buyers and its margins have always followed the supply cycle. The moat protects share, not today’s 50%+ margins.
2. Leadership & Capital Allocation
| Item | Detail |
|---|---|
| CEO | Dr. William D. (Dave) Mosley — CEO since Oct 2017, board chair since Oct 2025 (10-K) |
| CFO | Gianluca Romano — EVP & CFO since Jan 2019 (ex-Micron) |
| Board | Cut from 11 to 9 directors at the 24 Oct 2026 AGM; Mark Adams becomes lead independent director (proxy) |
| Ownership | Institutions 85.14%, insiders 0.26% (stockanalysis) |
| Insider dealings (12 months) | No open-market purchases. Sales: CEO ~450k shares (~US$304m), CFO ~223k (~US$146m), CCO ~127k (~US$89m), CTO ~38k (~US$31m), from SEC Form 4 filings (EDGAR) |
- Returns vs hurdle: return on invested capital 85.9% (stockanalysis, TTM) against our 13.0% WACC (ratios).
- Dividends: US$0.74 a quarter (US$2.96 a year, raised from US$0.72); latest ex/record date 24 Sep 2026, paid 7 Oct 2026. FY2026 dividends US$634m.
- Buybacks: US$176m in FY2026 under a US$5.0bn authorisation, with US$4.8bn left at 3 Jul 2026 — cash went to debt reduction first.
- Debt: cut by US$1.4bn in FY2026, then US$1bn of notes redeemed on 15 Jul 2026. Ratings Moody’s Ba1, S&P BBB- (positive), Fitch BBB- (Seagate IR).
- Dilution and M&A: exchangeable-note settlements were partly in shares (226.8m shares at 3 Jul 2026); no acquisitions found (NOT FOUND).
3. Financial Health
| US$m | FY2022 | FY2023 | FY2024 | FY2025 | FY2026 | FQ4 FY26 |
|---|---|---|---|---|---|---|
| Revenue | 11,661 | 7,384 | 6,551 | 9,097 | 12,195 | 3,629 |
| Gross profit | 3,469 | 1,411 | 1,536 | 3,200 | 5,558 | 1,898* |
| Operating income (stockanalysis basis; FQ4 GAAP) | 1,958 | -124 | 422 | 1,915 | 4,226 | 1,559 |
| Net income | 1,649 | -529 | 335 | 1,469 | 3,184 | 1,294 |
| Diluted EPS (US$) | 7.36 | -2.56 | 1.58 | 6.77 | 13.90 | 5.58 |
| Free cash flow | 1,276 | 626 | 664 | 818 | 3,105 | 1,118 |
| Dividends paid | 610 | 582 | 585 | 600 | 634 | n/a |
Sources: stockanalysis income statement, cash flow, FQ4 FY26 release. *FQ4 gross profit = revenue × 52.3% GAAP gross margin. GAAP operating income per the 10-K was US$4,094m in FY2026 (the US$132m gap to stockanalysis is the US$105m legal charge plus US$27m restructuring). Balance sheet at 3 Jul 2026: cash US$1,704m, debt US$3,565m, equity US$2,167m (a US$453m deficit a year earlier).
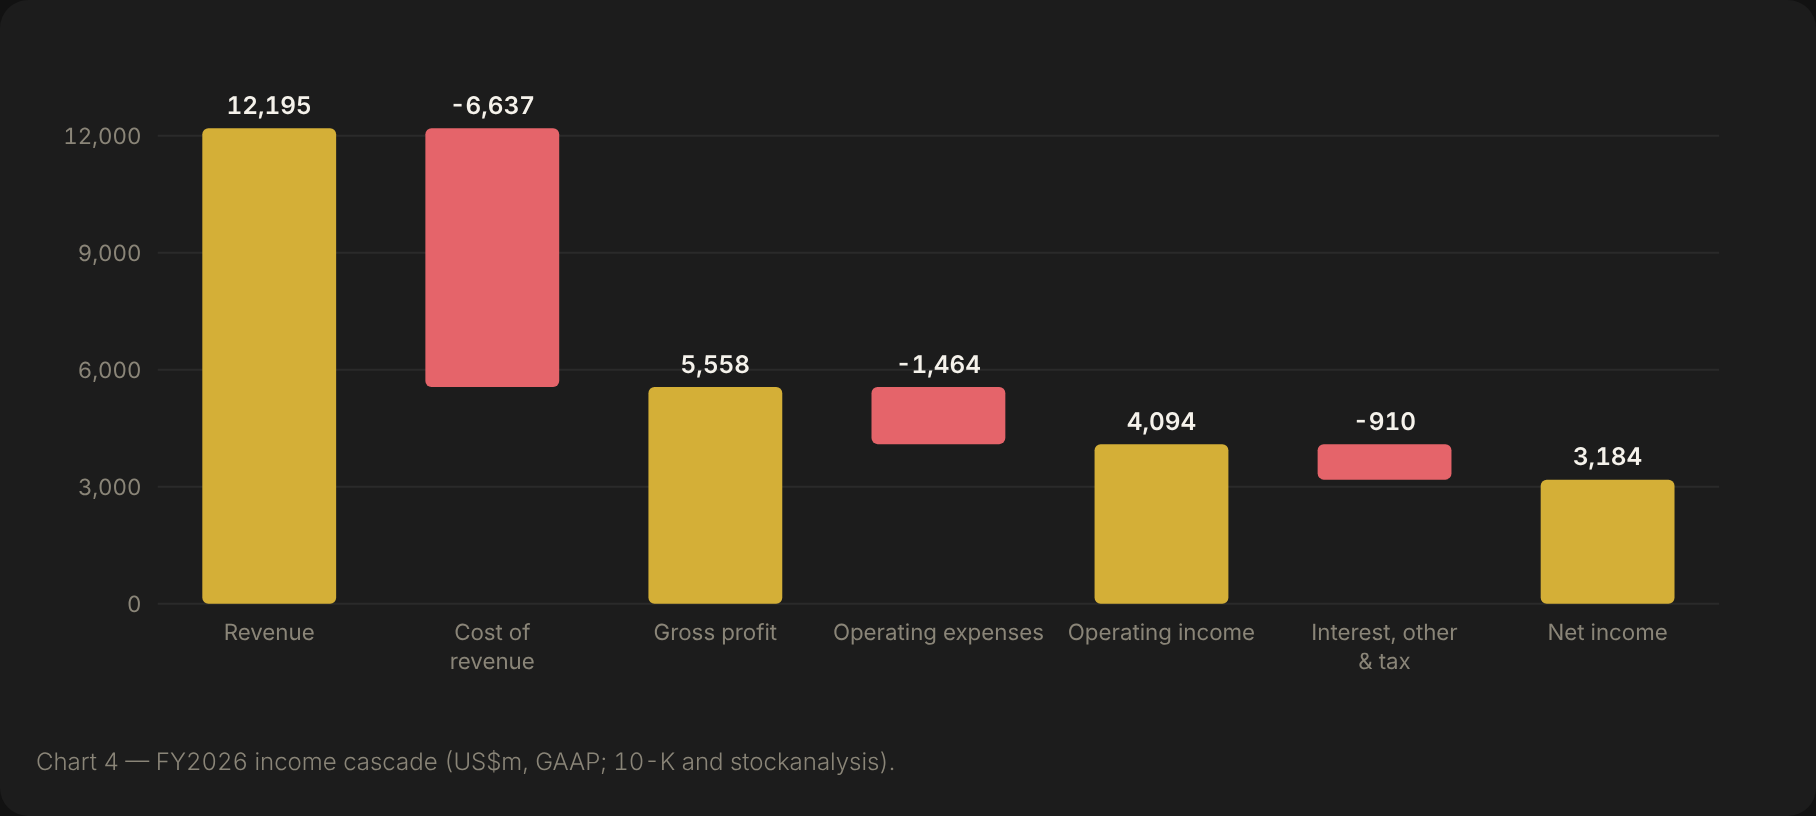
- Cash backs the profit: FY2026 operating cash flow US$3,674m vs net income US$3,184m; capex US$569m.
- One-offs: US$105m legal settlement charge in FY2026; non-GAAP EPS US$15.58 vs GAAP US$13.90.
- Stock compensation: US$213m in FY2026, about 7% of free cash flow.
- Cyclical history: revenue fell 44% from FY2022 to FY2024 and the company lost money in FY2023 — today’s margins are a cycle high, not a floor.
4. Risks
Macro & Regulatory
- Critical: Cycle reversal. Valuation rests on near-50% operating margins; in FY2023 the same business lost money.
- Watch: Export rules and trade. Seagate agreed a US$300m BIS civil penalty in 2023, payable in US$15m quarterly instalments over five years from 31 Oct 2023 (10-K).
- Watch: 40% of revenue is billed from Singapore/APAC; tariffs or regional disruption would hit shipments.
Operational & Competitive
- Serious: Supply response — Toshiba plans to double HDD output by FY2027 and target ~30% share (StartupFortune).
- Serious: Customer concentration — one customer ~14% of revenue; OEMs 81%.
- Watch: Flash substitution if SSD prices fall faster than HDD cost per terabyte.
Financial & Governance
- Watch: Heavy insider selling (~US$600m by executives in 12 months, no purchases).
- Watch: US$175m class-action settlement still needs final court approval (hearing date NOT FOUND).
- Watch: Leverage is low (net debt about US$1.9bn on 10-K figures, about 0.4x TTM EBITDA of US$4.50bn) — not a near-term risk.
5. Catalysts
| When | Measurable test | Odds |
|---|---|---|
| 24 Oct 2026 (AGM) | Board reduced to 9; no change to capital-return policy | 80% |
| 27 Oct 2026 (FQ1 FY27, expected) | Revenue ≥ US$4.0bn (low end of guide) | 80% |
| 27 Oct 2026 | FQ2 FY27 revenue guide midpoint ≥ US$4.5bn | 50% |
| FY2027 | Toshiba capacity ramp visible in HDD pricing (Seagate GM falls below 50%) | 35% |
Bull vs consensus: 25 analysts — 18 Strong Buy, 4 Buy, 2 Hold, 1 Sell; average target US$1,125 (low US$700, high US$1,600); FY2027 consensus revenue US$18.78bn and EPS US$35.78 (stockanalysis, 5 Oct 2026). FY2028 consensus EPS US$57.43 on US$26.0bn revenue is from WallStreetZen (page dated 30 Jul 2026). Our bull case (US$880) already needs FY2028 revenue of US$28bn and operating margins of 42% or more through FY2031.
6. Valuation Suite
6a. Cost of Capital
| Input | Value | Source / note |
|---|---|---|
| Risk-free (US 10-year Treasury, 1 Oct 2026) | 5.24% | FRED DGS10 via Alpha Vantage |
| Own 2-yr weekly beta vs S&P 500 | 2.25 | IBKR weekly closes, 104 weekly returns to 5 Oct 2026 |
| Peer median beta (check) | 1.45 | stockanalysis 5-year betas: WDC, MU, NTAP, P, DELL |
| Raw beta used | 1.85 | Average of the two (gap > 0.3), per method |
| Adjusted beta (0.67×raw+0.33) | 1.57 | |
| Equity risk premium | 5.0% | Developed market (assumption) |
| Size/illiquidity premium | 0% | Mega-cap, US$201.7bn market value |
| Cost of equity | 13.09% | Used in DCF, residual income and peer discounting |
| Debt weight / after-tax cost of debt | 1.7% / 5.76% | Weighted coupon 6.78% (10-K maturity table) × (1 − 15% assumed tax) |
| WACC | 12.96% |
6b. Discounted Cash Flow (DCF)
| US$m | FY27E | FY28E | FY29E | FY30E | FY31E |
|---|---|---|---|---|---|
| Revenue | 18,780 | 26,000 | 27,300 | 25,935 | 26,454 |
| Growth | +54% | +38% | +5% | -5% | +2% |
| EBIT margin | 49% | 52% | 45% | 40% | 35% |
| EBITDA | 9,634 | 14,118 | 12,913 | 10,971 | 9,867 |
| Free cash flow to firm | 6,986 | 10,429 | 9,640 | 8,186 | 7,130 |
| Present value | 6,375 | 8,426 | 6,895 | 5,183 | 3,996 |
Unlevered free cash flow (FCFF) at a 12.96% WACC. Year 1 = FY2027 consensus revenue US$18.78bn (the company guides only one quarter; the FQ1 guide of US$4.1bn is consistent with it); year 2 = FY2028 consensus US$26.0bn; then +5%, −5%, +2% as supply catches up. EBIT margin 49% and 52% in the boom years (FQ4 FY26 non-GAAP operating margin was 44.6%), fading to 35% by FY2031 — still well above the FY2026 average of 36.5%. Tax 15% (assumption; FY2026 effective rate 13.73% per the 10-K), D&A 2.3% and capex 5% of revenue (FY2026: 2.3% and 4.7%), working capital 5% of incremental revenue. Net debt US$1,861m (10-K) and 227.39m shares.
| Case | Key differences | Perpetuity (g) | Exit multiple | DCF value |
|---|---|---|---|---|
| Bear | FY27 US$17.0bn, FY28 US$19.5bn, then falls to US$15.0bn; margin 45% → 25% | US$137 (g 2.5%) | US$160 (9x) | US$148 |
| Base | Consensus FY27–28, then +5/−5/+2%; margin 49–52% → 35% | US$309 (g 3.0%) | US$419 (12x) | US$364 |
| Bull | FY28 US$28.0bn rising to US$32.5bn; margin 54% → 42% | US$447 (g 3.5%) | US$692 (15x) | US$569 |
Implied discount rate: the base-case cash flows equal today’s US$887.09 price at 5.4%, versus our 13.0% WACC.
6c. Residual Income
| US$ per share | FY27E | FY28E | FY29E | FY30E | FY31E |
|---|---|---|---|---|---|
| Opening book | 9.53 | 34.58 | 74.78 | 106.92 | 134.07 |
| EPS | 35.78 | 57.43 | 45.92 | 38.78 | 34.61 |
| ROE on opening book | 375% | 166% | 61% | 36% | 26% |
| Residual income | 34.53 | 52.90 | 36.13 | 24.78 | 17.06 |
Book value is only US$9.53 a share (US$2,167m), so the stock trades at 93x book. Value with full persistence US$232; with 50% persistence US$142; justified P/B at the FY2031 ROE = 2.26x. Book value was negative a year ago, so it does not measure the capital at work. Shown for reference only (0% weight) — asset-light by the method’s test, P/B above 10x.
6d. Peers (Stockanalysis, Prices at 5 Oct 2026)
| Ticker | Price | Mkt cap | Fwd P/E | EV/EBITDA | 3-yr growth fcst |
|---|---|---|---|---|---|
| STX | US$887.09 | US$201.7bn | 23.73 | 45.54 | NOT FOUND |
| WDC | US$441.64 | US$159.2bn | 21.97 | 31.73 | NOT FOUND |
| SNDK | US$1,704.16 | US$249.5bn | 7.97 | 19.27 | NOT FOUND |
| MU | US$1,063.96 | US$1.20tn | 6.03 | 10.41 | NOT FOUND |
| NTAP | US$226.12* | US$44.4bn | 22.79 | 20.72 | NOT FOUND |
| P (Everpure, ex-Pure Storage) | US$143.88 | US$47.9bn | 42.98 | 122.73 | NOT FOUND |
| DELL | US$552.49* | US$351.3bn | 19.99 | 21.24 | NOT FOUND |
| Peer median (ex STX) | 20.98 | 20.98 |
Peer method: median forward P/E of all six profitable peers (20.98x) × FY2028 consensus EPS US$57.43 = US$1,205 a year out, discounted one year at the 13.09% cost of equity = US$1,065. Cross-check: STX’s trailing EV/EBITDA of 45.5x is more than double the peer median of 21.0x. *Intraday prices on 5 Oct 2026. Next-year growth from stockanalysis (e.g. WDC revenue +48.6%, MU +106.3%); 3-year forecasts are not on the free pages.
6e. Single-lever Test
| Input changed alone | Low | High | Swing |
|---|---|---|---|
| Peer P/E 15x / 25x | US$563 | US$817 | US$254 |
| FY2028 consensus EPS -20% / +20% | US$608 | US$821 | US$213 |
| Margin after FY28: fade to 25% / hold 52% (DCF) | US$673 | US$783 | US$110 |
| Revenue path -/+15% (DCF) | US$687 | US$743 | US$56 |
| EBIT margin path -/+5 pts (DCF) | US$690 | US$740 | US$51 |
| WACC +/-2 pts (DCF) | US$696 | US$741 | US$45 |
The biggest lever is the peer multiple: moving the forward P/E applied to FY2028 EPS from 15x to 25x shifts fair value from US$563 to US$817. Within the DCF, the biggest lever is how long margins stay high (fair value US$673–US$783). Values are fair value (50% DCF / 50% peers) with only that input changed.
7. Synthesis
| Method | Inputs | Value | vs price | Weight | Weighted |
|---|---|---|---|---|---|
| DCF (FCFF) | WACC 13.0%, g 3%, exit 12x | US$364 | -58.9% | 50% | US$182 |
| Residual income | Reference only (P/B 93x) | US$142 | -84.0% | 0% | US$0 |
| Peers | 20.98x × FY28 EPS US$57.43 | US$1,065 | +20.1% | 50% | US$533 |
| Fair value | US$715 | ||||
| Bear / Base / Bull | DCF cases; peers on bear/consensus/bull FY28 EPS | US$397 / US$715 / US$880 | -55.3% / -19.4% / -0.7% |
How much rests on consensus: half the fair value comes from peers applied to FY2028 consensus EPS of US$57.43 — a forecast for a year in which revenue would be more than double FY2026. On our bear-case revenue path (FY2028 US$19.5bn, EPS about US$34.79) the peer value falls to US$645 and the blended fair value to US$505 (-43.1% vs price).
Margin of safety: none — the price is +24.1% above our fair value. A 30% margin of safety would mean a price of about US$500. The implied discount rate of 5.4% vs our 13.0% WACC shows how much good news is already in the price.
8. Technicals
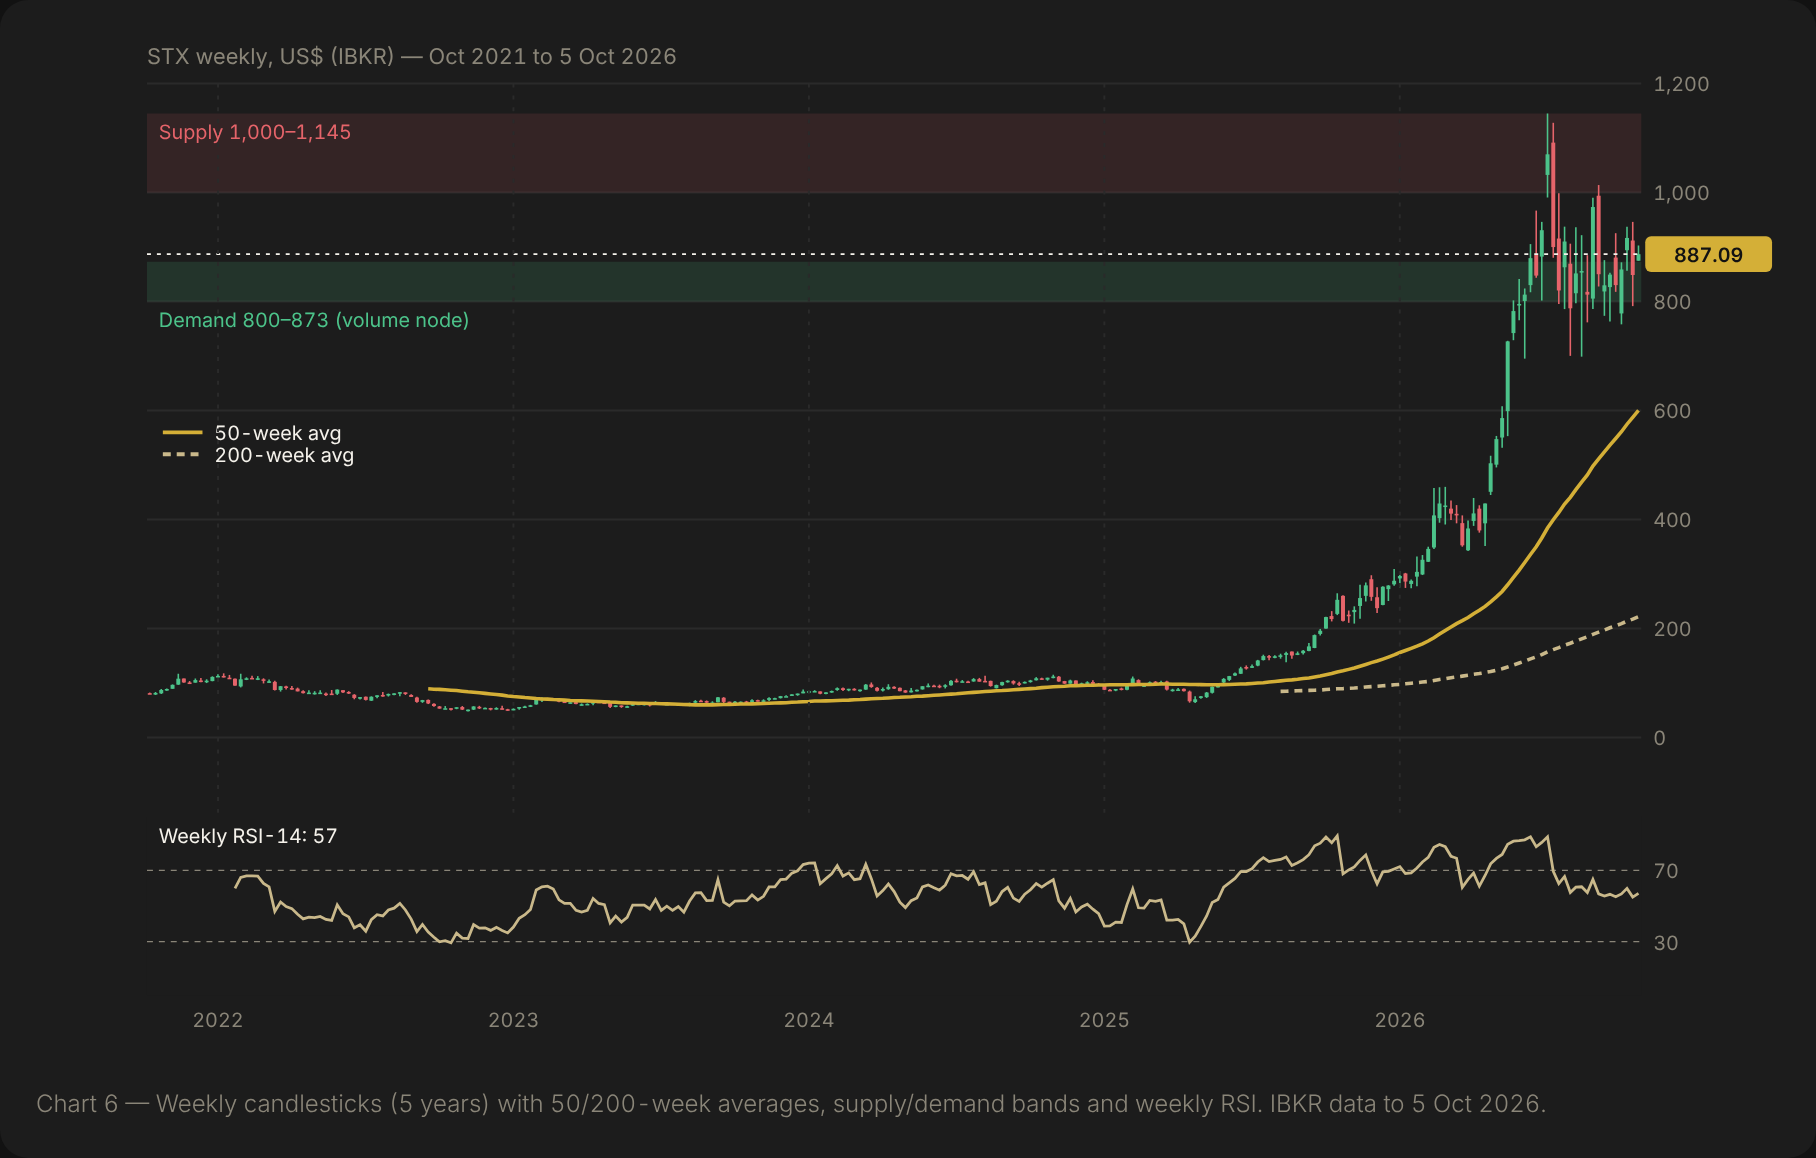
Trend: up, but stalled. The price (US$887.09) is above the 50-day (US$855.42) and 200-day (US$653.70) averages, just below the 100-day (US$871.45), and the 50-day is above the 200-day. Momentum: daily RSI 52 and weekly RSI 57 are neutral; the daily MACD histogram has faded to 1.22 from 11.51 a week ago. Volatility: 20-day average true range is US$52.63 a day (about 6% of the price). Volume: the heaviest one-year volume-by-price zone is US$800–873, just below the price; 2 Oct traded 9.2m shares on IBKR, about 3.7 times the 1-year daily average.
| Level | Price | Basis |
|---|---|---|
| Resistance 2 | US$1,145.00 | 52-week and 5-year high (mid-June 2026) |
| Resistance 1 | US$1,013.99 | 60-day high (August 2026) |
| Current | US$887.09 | 5 Oct 2026 close |
| Support 1 | US$800.00–873.00 | Largest 1-year volume-by-price zone; 50-day average US$855.42 |
| Support 2 | US$758.35 | 20-day low (September 2026) |
| Support 3 | US$698.99 | 60-day low (28 Jul 2026) |
Our Dated Calls
Pre-registered; scored on the dates shown (results are expected after the US close on 27 Oct, so results calls are scored on 28 Oct). Price calls use total return after ~0.1% trading costs.
| # | Call | Probability | Scoring date |
|---|---|---|---|
| 1 | FQ1 FY27 revenue ≥ US$4.0bn | 80% | 28 Oct 2026 |
| 2 | FQ1 FY27 non-GAAP EPS ≥ US$7.30 | 60% | 28 Oct 2026 |
| 3 | FQ2 FY27 revenue guidance midpoint ≥ US$4.5bn | 50% | 28 Oct 2026 |
| 4 | Quarterly dividend declared ≥ US$0.74 | 90% | 28 Oct 2026 |
| 5 | STX total return from US$887.09 is negative after costs | 55% | 6 Apr 2027 |
| 6 | STX closes below US$700 at least once | 40% | 6 Apr 2027 |
Bull Case
- Revenue guided to US$4.1bn for FQ1 FY27 — run-rate above US$16bn a year, with gross margin above 52%.
- 44TB HAMR drives in production and long-term agreements through CY2027 give unusual visibility.
- Free cash flow of US$3.1bn in FY2026, debt falling and a Ba1/BBB- balance sheet.
Bear Case
- The price needs a 5.4% discount rate to work on our base case — peak margins must last for years.
- Toshiba is doubling HDD output by FY2027; supply responses have ended every previous HDD up-cycle.
- Executives sold about US$600m of stock in 12 months and bought none.
FAQ
What is Seagate’s fair value?
Our 12-month fair value is US$715 per share (range US$397–US$880), from 50% DCF (US$364) and 50% peers (US$1,065), -19.4% vs the US$887.09 close on 5 Oct 2026.
Is Seagate undervalued?
No — on our numbers it looks overvalued. The price implies a 5.4% discount rate on our base-case cash flows, versus a 13.0% WACC.
What are the main risks for Seagate?
A turn in the HDD cycle (operating margin is near 45% vs a loss in FY2023), Toshiba doubling its output by FY2027, customer concentration (one customer ~14% of revenue) and steady insider selling.
When are Seagate’s next results?
FQ1 FY2027 results are expected on 27 Oct 2026 after the US close (stockanalysis; not yet confirmed by Seagate). Guidance is US$4.1bn revenue and US$7.30 non-GAAP EPS.
Does Seagate pay a dividend?
Yes — US$0.74 a quarter (US$2.96 a year), a 0.3% yield at US$887.09. The latest was paid on 7 Oct 2026.
Method and Sources
Operating-company valuation: unlevered DCF at WACC (perpetuity-growth and exit EV/EBITDA terminals averaged) and a peer forward-P/E value on FY2028 consensus EPS, weighted 50/50 because the company is asset-light by our test (P/B 93x); residual income is shown for reference. One discount rate (13.09% cost of equity, 12.96% WACC) is used throughout. Prices are IBKR NASDAQ closes to 5 Oct 2026; stockanalysis’s history page shows a 5 Oct 2026 close of US$889.39 and its statistics page US$887.09 — the live IBKR figure (US$887.09) is used. S&P 500 membership confirmed on the stockanalysis S&P 500 list; no pending index change (S&P DJI, 1 Oct 2026). Figures independently fact-checked against the linked sources on 6 Oct 2026.
- Prices, beta, technicals: Interactive Brokers market data (STX @NASDAQ; SPX index).
- FY2026 10-K · FQ4 FY26 release · FQ3 · FQ2 · FQ1 · 2026 proxy · Form 4 filings · credit ratings
- Consensus and statistics: stockanalysis forecast · statistics · financials · ratios · dividends · WallStreetZen FY2028
- Peers: stockanalysis statistics (WDC, SNDK, MU, NTAP, P, DELL pages). Risk-free: FRED DGS10.
- News: Benzinga · 24/7 Wall St · StartupFortune · GuruFocus (Citi) · ad-hoc-news (Zacks) · Benzinga (CFO sale) · StockTitan (CEO Form 4) · StockTitan (notes) · Blocks & Files · Claims Journal · MarketScreener · investing.com (Moody’s) · Yahoo (Morgan Stanley)
Not located (NOT FOUND): Seagate confirmation of the FQ1 FY27 results date; a FY2028 consensus dated after 30 Jul 2026; full-year FY2027 company guidance; mass-capacity vs legacy revenue split; annual EBITDA history; 3-year peer growth forecasts and a Sandisk beta; supplier concentration; final share count issued on the 2028 exchangeable notes; 60-day estimate revisions; long-run US nominal GDP (terminal growth of 3% is an assumption).
Analysis only, not a recommendation to buy or sell any security. Figures as at 5 Oct 2026; sources linked. The author does not hold a position in STX.
Get the next report by email
One independent, fact-checked equity research report each weekday on Singapore and US stocks, with every prediction scored in public. Free.


Leave a comment