
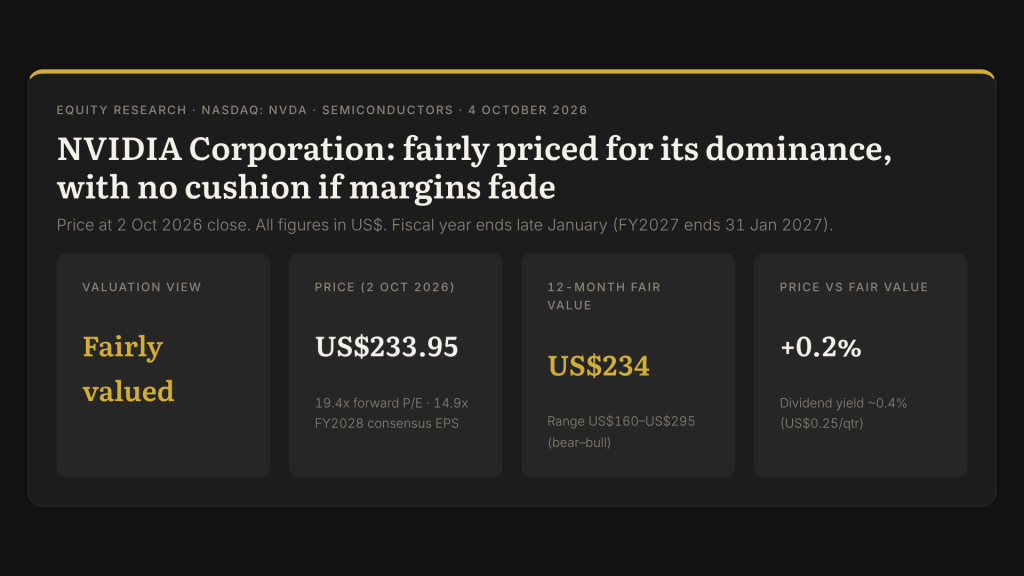
Download the full report (PDF)
Snapshot
| Item | Value |
|---|---|
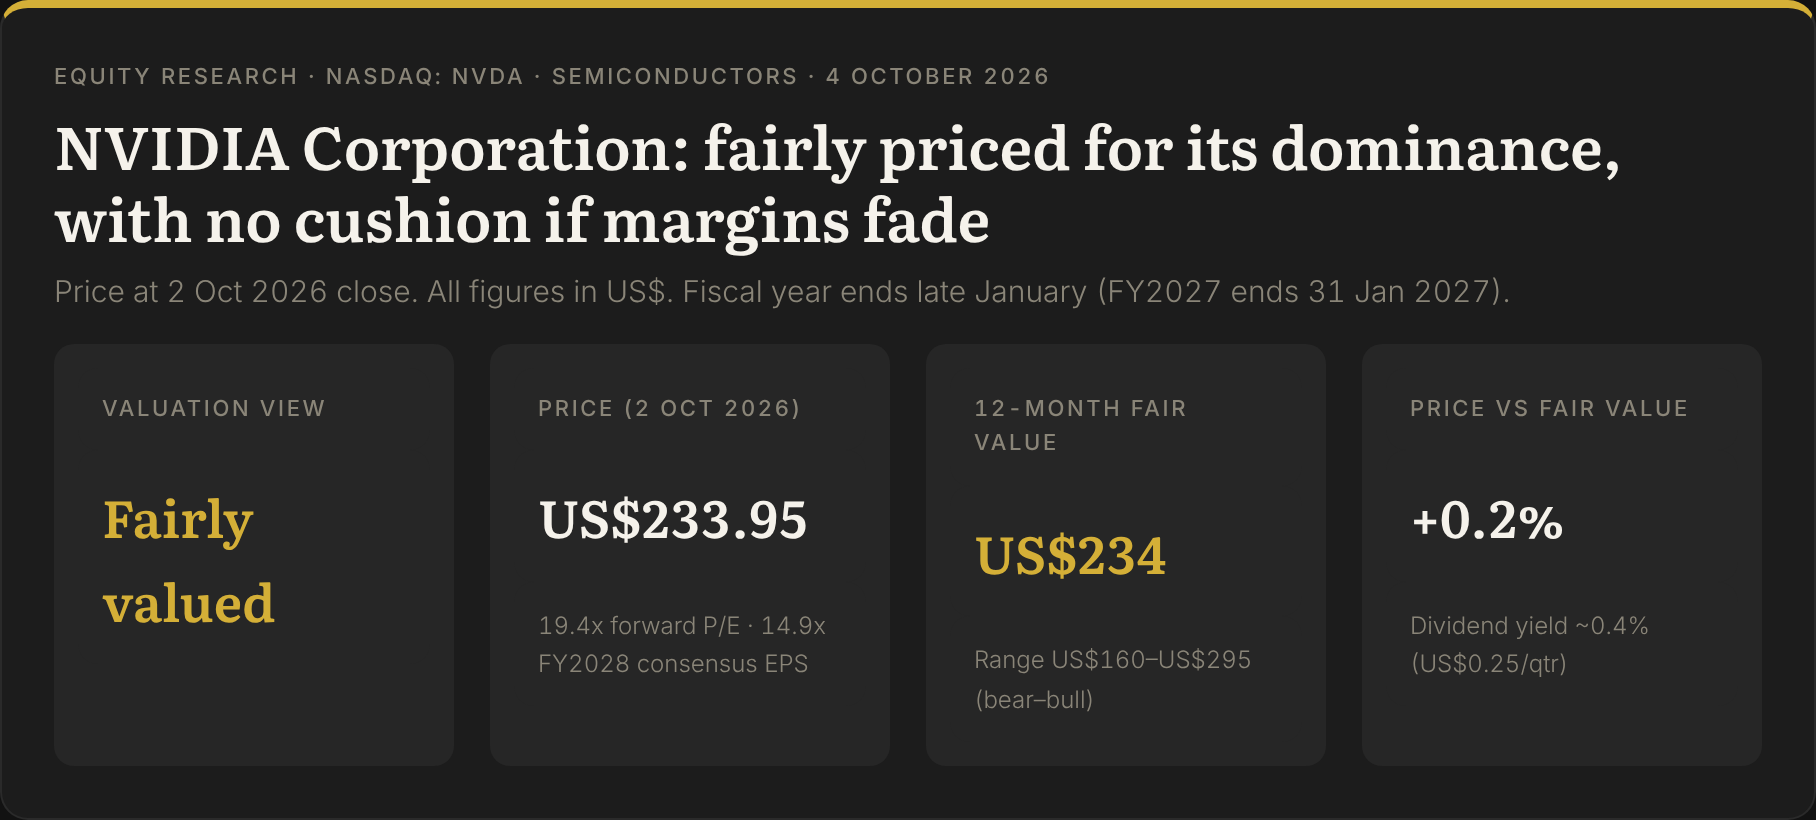
| Valuation view | Fairly valued (+0.2% to fair value) |
| Current price | US$233.95 (2 Oct 2026 close; 19.4x forward P/E) |
| 12-month fair value | US$234 (50% DCF / 50% peers) |
| Bear–bull range | US$160 (-31.4%) to US$295 (+26.2%) |
| Dividend yield | 0.4% |
Key Takeaways
- Fairly valued: our fair value of US$234 is in line with the US$233.95 close on 2 Oct 2026 (range US$160–295), so there is no margin of safety.
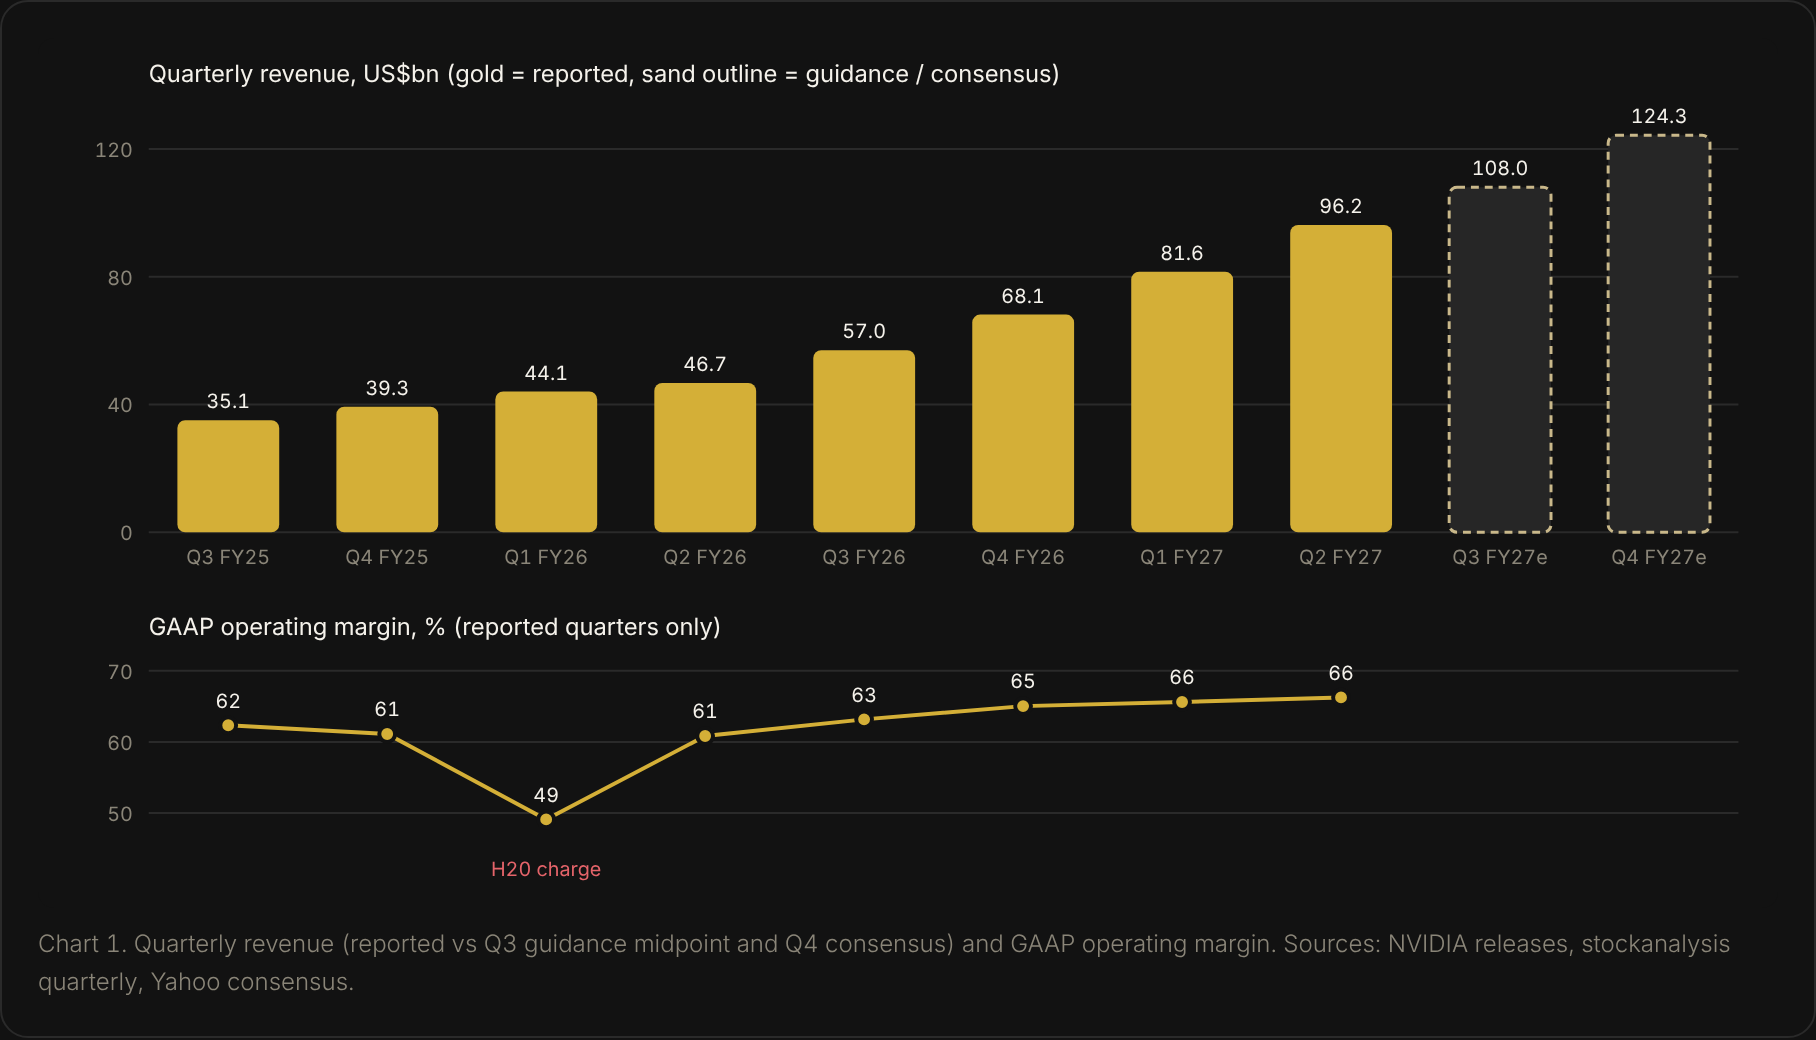
- The business is firing: Q2 FY2027 revenue was US$96.2bn (+106% y/y) at a 66.2% GAAP operating margin, with Q3 guided to US$108.0bn.
- It hinges on margins: base-case cash flows return 10.7% a year at today’s price versus our 13.7% cost of capital; FY2029–31 operating margin is the single biggest lever (US$158–226 per share for ±10 points).
The Verdict
Fairly valued — fair value US$234 (range US$160–US$295), +0.2% vs US$233.95 (2 Oct 2026 close).
What is working is close to everything: Q2 FY2027 revenue of US$96.2bn was up 106% year on year, the GAAP operating margin reached 66.2%, Q3 guidance is US$108.0bn, and management talked of roughly 70% growth in FY2028. The share has risen 25.4% this year to a record and sits 1.7% below its 52-week high of US$237.88. The price already reflects that. Our cash-flow model and peer multiples together put fair value at today’s price, which leaves no margin of safety. On cash flows alone, at our 13.7% cost of capital, the price needs operating margins of about 62–70% through FY2031 instead of fading towards 50% as competition and customer in-house chips arrive; the base-case cash flows return 10.7% a year at today’s price. The single factor that decides it: whether NVIDIA can hold operating margins above ~60% after the current build-out (FY2029–31). That one input moves our DCF more than any other (US$158–226 for ±10 points).
Recent Developments (Last 12 Months)
| Date | Event | Why it matters |
|---|---|---|
| 2 Oct 2026 | Record high: intraday US$237.88; close US$233.95 (+1.3%) | Price at peak while consensus targets average US$328 |
| 28 Sep 2026 | Buyback authorization raised by US$150bn to ~US$235bn, to be used through FY2028 | About 4% of market cap; supports EPS but uses cash that could fund the US$279bn supply commitments |
| 28–29 Sep 2026 | After the Trump–Xi summit, Asia Times reports NVIDIA plans RTX PRO 5500 shipments to China from late December (~500k/qtr); Blackwell data-center parts still restricted | China re-entry is upside not in guidance |
| 18–23 Sep 2026 | Insider sales: director Mark Stevens ~1.37m shares at ~US$220; CFO Colette Kress 34,918 shares (10b5-1); GC Tim Teter 30,460 shares. CEO Jensen Huang’s Sep 2026 Form 4: tax withholding and a 438,000-share gift, no open-market sale | Selling by directors and officers; the CEO’s September filing shows no sale |
| 10 Sep 2026 | US DOJ reported to be probing whether the ~US$20bn Groq licence deal was structured to avoid merger review | Antitrust overhang on deal-making |
| 2–3 Sep 2026 | Agreement to acquire Hugging Face for ~US$11.9bn plus up to ~US$1.0bn retention equity (8-K); close expected H1 2027 | Software/ecosystem moat extension; regulatory approval needed |
| 26 Aug 2026 | Q2 FY2027: revenue US$96.2bn (+106%), Data Center US$89.0bn, GAAP EPS US$2.46; Q3 guide US$108.0bn ±2% with no China data-center compute assumed | Beat-and-raise cadence intact |
| 27 Aug 2026 | Target raises: Raymond James US$352→515, Evercore 413→465, Bernstein 315→400, JPMorgan 280→320, UBS 280→300 | Street-high target US$515 |
| 17 Aug 2026 | 8-K: residual value guarantees for SB Energy/OpenAI Ohio campus, obligation capped at US$105bn (~4.25 GW) | Large contingent exposure to one customer ecosystem |
| 27 Jul 2026 | Shares fell ~5% on reports NVIDIA may backstop US$250bn of OpenAI compute leases (“circular financing”) | Financing-loop risk now priced in news flow |
| 1 Jul 2026 | Nicholas Parker (ex-Microsoft) named EVP Worldwide Field Operations from 24 Aug, succeeding the retiring Ajay Puri | Sales leadership change |
| June 2026 | Long-term debt rose from US$7.5bn (Jan) to US$32.4bn (Jul) after note issues | Still net cash; first meaningful leverage in years |
| 20 May 2026 | Q1 FY2027: revenue US$81.6bn (+85%); quarterly dividend raised from US$0.01 to US$0.25; US$80bn buyback added | Capital return step-change |
| 31 Mar 2026 | OpenAI closes US$122bn round; NVIDIA a participant (reported at ~US$30bn in Feb 2026) | Equity exposure to its largest customer ecosystem |
| 29 Dec 2025 | US$5bn Intel stake closes: 214.7m shares at US$23.28 | Strategic stake; now a sizeable mark-to-market gain |
| Next: 17 Nov 2026 | Q3 FY2027 results after the US close (Wall Street Horizon lists the date as confirmed) | Test of the US$108bn guide |
Key Numbers
| Metric | Value | Basis |
|---|---|---|
| Forward P/E | 19.4x | NTM, stockanalysis, 2 Oct 2026 |
| Price / book | 24.8x | Equity US$229.0bn at 26 Jul 2026 |
| Revenue growth | +106% | Q2 FY2027 y/y |
| Cost of equity / WACC | 13.7% / 13.7% | rf 5.28% + 1.69 adj. beta x 5% ERP |
| Supply & capacity commitments | US$279bn | 26 Jul 2026, up from US$119bn a quarter earlier |
| Drawdown from high | −1.7% | 52-wk range US$164.27–237.88 |
1. Business & Moat
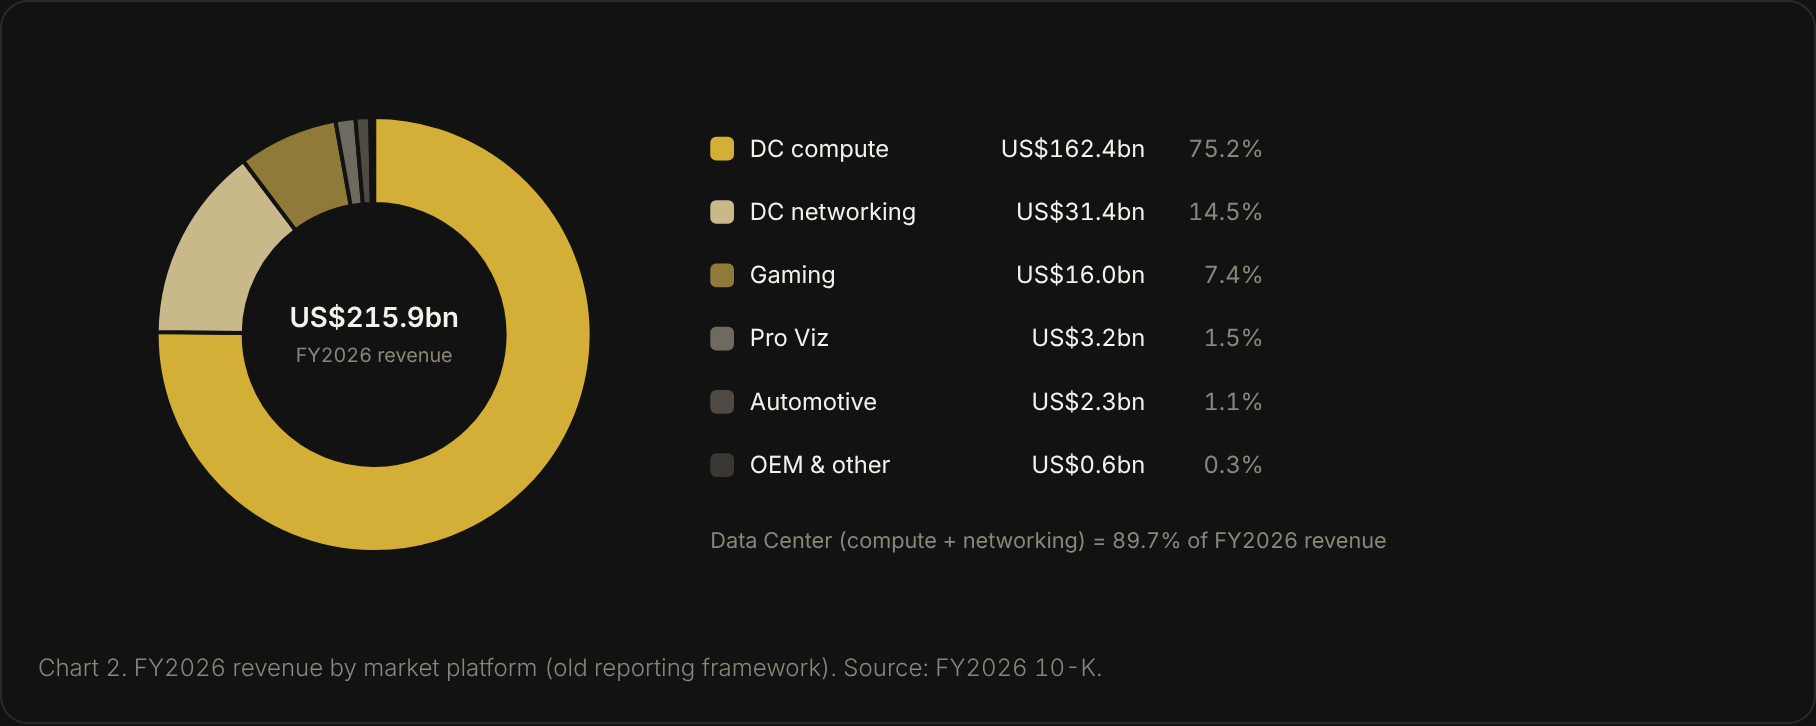
NVIDIA designs accelerated-computing platforms: GPUs, CPUs, networking (InfiniBand, Spectrum-X Ethernet, NVLink), systems and the CUDA software stack. Since Q1 FY2027 it reports two market platforms — Data Center (Hyperscale, and AI Clouds, Industrial & Enterprise) and Edge Computing (PCs, workstations, consoles, automotive, robotics) — while keeping two reportable segments, Compute & Networking and Graphics.
| Q2 FY2027 (to 26 Jul 2026) | Revenue | y/y |
|---|---|---|
| Data Center | US$89.0bn | +117% |
| — Hyperscale | US$48.7bn | +102% |
| — AI Clouds, Industrial & Enterprise | US$40.3bn | +138% |
| Edge Computing | US$7.2bn | +27% |
| Total | US$96.2bn | +106% |
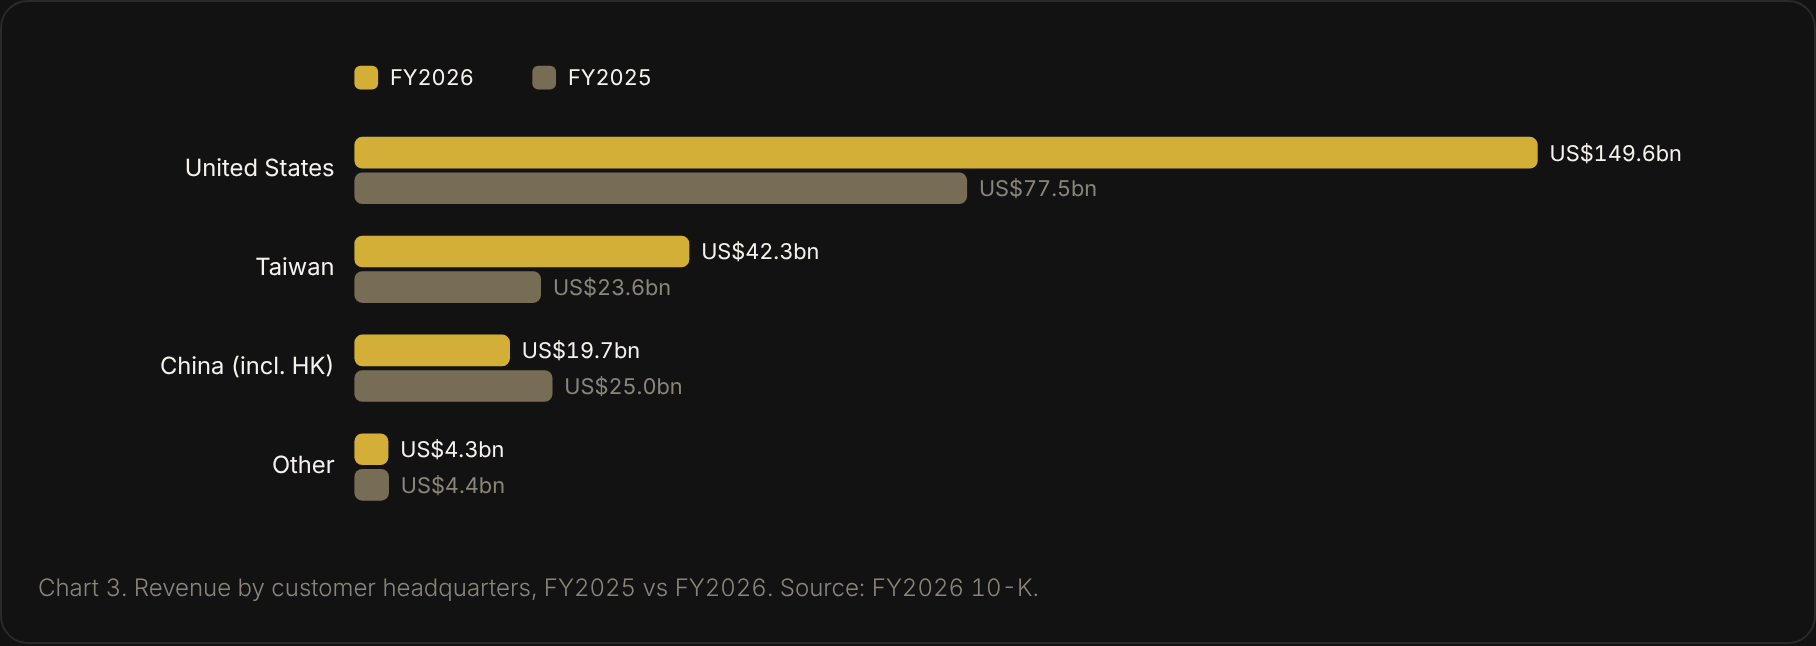
Customers: concentrated. In FY2026 two direct customers were 22% and 14% of revenue; in Q2 FY2027 one was 16%, and five customers held 10–22% of receivables each. Geography (by customer headquarters): US US$149.6bn, Taiwan US$42.3bn, China incl. Hong Kong US$19.7bn (down from US$25.0bn), other US$4.3bn in FY2026. Guidance: Q3 FY2027 revenue US$108.0bn ±2%, gross margin 74.0% ±50bp, non-GAAP opex ~US$9.0bn, no China data-center compute revenue assumed.
Porter’s Five Forces
| Force | Strength | Evidence |
|---|---|---|
| Rivalry | Rising | AMD trades at 57x forward earnings on 52% expected growth; Broadcom custom silicon growing; Intel re-entering |
| Buyer Power | High | Top customers 16–22% of revenue; hyperscalers building in-house accelerators |
| Supplier Power | High | US$279bn supply/capacity commitments, mostly memory; dependence on TSMC |
| Threat of Substitutes | Medium | Custom ASICs and inference chips (e.g. Groq technology, now licensed by NVIDIA) |
| Threat of Entry | Low | CUDA ecosystem, networking, system-scale integration and US$18.5bn FY2026 R&D |
Moat verdict: wide but contested. The software, networking and systems lead is real and showing in a 75% gross margin. The risk is not losing the market but sharing it at lower margins once supply catches up.
2. Leadership & Capital Allocation
| Item | Detail |
|---|---|
| CEO | Jensen Huang, co-founder; 870.6m shares = 3.58% (23 Mar 2026). FY2026 total pay US$36.3m; CEO-to-median ratio 129:1 |
| CFO | Colette Kress |
| Other changes | Nicholas Parker EVP Worldwide Field Ops (from 24 Aug 2026); Scott Gawel CAO (from 4 May 2026) |
| Insider Dealings | Huang completed his 2025 10b5-1 sale plan on 31 Oct 2025; his Sep 2026 Form 4 shows tax withholding and a gift, no sale. Executives and directors sold ~US$846.7m in the three months to Sep 2026 (GuruFocus), incl. director Mark Stevens ~1.37m shares in Sep |
| Returns vs Hurdle | ROE 101.5% in FY2026 vs a 13.7% cost of equity |
| Buybacks | US$40.4bn (282m shares) in FY2026 per the 10-K; US$39.0bn paid in H1 FY2027; ~US$235bn authorization after 28 Sep 2026 |
| Dividend | US$0.25 per quarter since May 2026 (was US$0.01) |
| Debt | Short-term US$1.0bn + long-term US$32.4bn vs cash and marketable debt securities US$56.6bn (26 Jul 2026) |
| Dilution | Diluted shares 24,532m (Q2 FY2026) → 24,285m (Q2 FY2027), −1.0% |
| M&A / Investments | ~US$20bn Groq licence (Dec 2025); US$5bn Intel stake; reported ~US$30bn in OpenAI’s US$122bn round; up to US$10bn Anthropic; Hugging Face ~US$11.9bn pending |
3. Financial health
| US$m | FY2022 | FY2023 | FY2024 | FY2025 | FY2026 | TTM (Q2 FY27) |
|---|---|---|---|---|---|---|
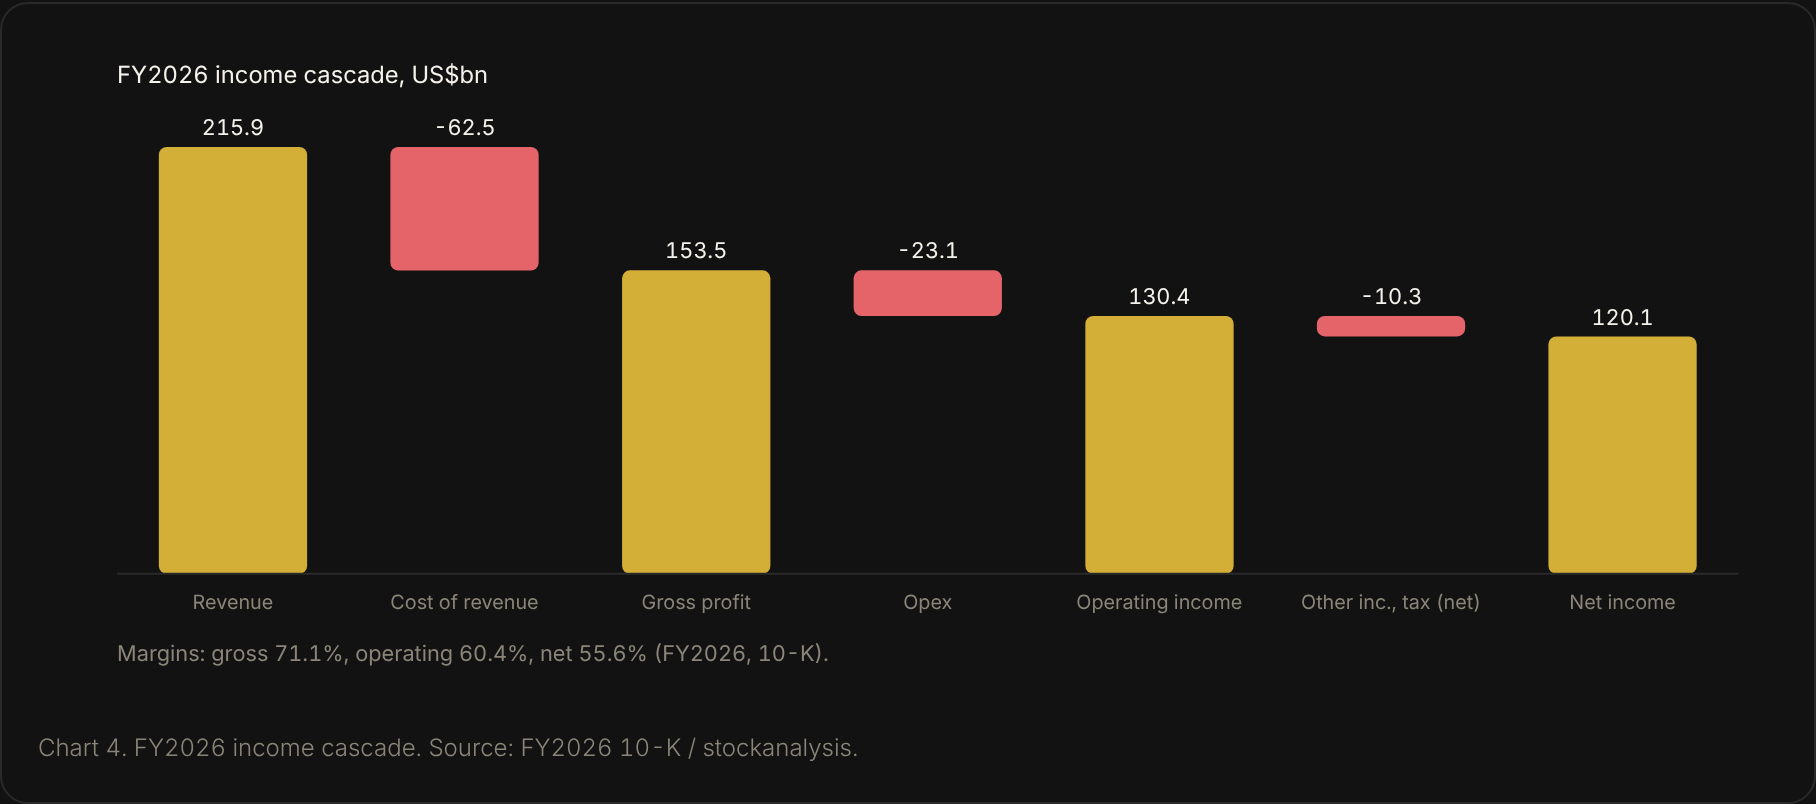
| Revenue | 26,914 | 26,974 | 60,922 | 130,497 | 215,938 | 302,970 |
| Operating Income | 10,041 | 5,577 | 32,972 | 81,453 | 130,387 | 197,579 |
| Net Income | 9,752 | 4,368 | 29,760 | 72,880 | 120,067 | 192,880 |
| Diluted EPS (US$) | 0.39 | 0.17 | 1.19 | 2.94 | 4.90 | — |
| Free Cash Flow | 8,132 | 3,808 | 27,021 | 60,853 | 96,676 | 127,006 |
| Stock-Based Comp | 2,004 | 2,709 | 3,549 | 4,737 | 6,386 | 7,241 |
| ROE | 44.8% | 17.9% | 91.5% | 119.2% | 101.5% | 117.2% |
Latest period Q2 FY2027: revenue US$96,221m, GAAP operating income US$63,734m, net income US$59,688m, operating cash flow US$24,077m, FCF US$21,341m.
- Gains flatter GAAP EPS: Q2 FY2027 GAAP net income includes ~US$7.8bn of equity-investment gains; non-GAAP EPS (US$2.22) is below GAAP (US$2.46).
- Cash conversion dipped: Q2 operating cash flow was US$24.1bn against US$59.7bn net income as receivables reached US$63.1bn (60 days) and inventory rose to US$31.6bn for Vera Rubin.
- Off-balance-sheet: US$279bn supply commitments, US$29bn cloud service agreements and a guarantee capped at US$105bn for the Ohio OpenAI campus.
- SBC is small relative to profit: US$7.2bn TTM, about 3.8% of net income.
4. Risks
Macro & Regulatory
- Serious: China export controls: Q3 guide assumes zero China data-center compute; H200 shipments were under 1% of Q2 Data Center revenue and carry a 25% US tariff on import.
- Serious: Antitrust: China’s preliminary finding on Mellanox conditions; reported DOJ probe of the Groq deal; French and other information requests.
- Watch: Rates: a 5.28% 10-year yield makes long-duration cash flows worth less.
Operational & Competitive
- Critical: Margin fade: our base case lets operating margin drift from 66% to 50% by FY2031; the price assumes it stays ~62–70%.
- Serious: Customer concentration and in-house chips at the largest buyers.
- Serious: Supply commitments of US$279bn (mostly memory) would bite if demand pauses.
Financial & Governance
- Serious: Circular financing: equity stakes in and guarantees for customers (OpenAI ~US$30bn stake; US$105bn guarantee cap).
- Watch: Earnings quality: investment gains inside GAAP profit; ~US$847m of executive and director selling in the three months to Sep 2026.
5. Catalysts
| When | Measurable test | Odds (our estimate) |
|---|---|---|
| 17 Nov 2026 | Q3 FY2027 revenue ≥ US$108.0bn guide midpoint | 80% |
| 17 Nov 2026 | Q4 FY2027 guide ≥ US$124.3bn (current Q4 consensus) | 60% |
| Late Dec 2026 | First RTX PRO 5500 shipments to China confirmed | 45% |
| H1 2027 | Hugging Face deal closes | 70% |
| Feb 2027 | FY2027 revenue ≥ US$411.6bn consensus | 70% |
Bull case vs consensus: consensus (Yahoo, 58 analysts) has FY2028 revenue at US$683bn and EPS at US$15.70, up 22% in 60 days; management’s ~70% FY2028 growth comment implies ~US$700bn. Our bull case (FY2028 +75%, margins ~60%+ held to FY2031, 22x exit) gives a DCF of US$300.
6. Valuation Suite
6a. Cost of Capital
| Input | Value | Source / note |
|---|---|---|
| Risk-free (US 10-yr Treasury) | 5.28% | US Treasury par yield curve, 2 Oct 2026 |
| Own 2-yr Weekly Beta vs S&P 500 | 1.84 | IBKR weekly closes, Oct 2024 – 2 Oct 2026 (104 weeks) |
| Peer Median Beta (Check) | 2.23 | Median of the 8 peers, stockanalysis, 2 Oct 2026 |
| Raw Beta Used | 2.03 | Average of the two, as they differ by more than 0.3 (rule) |
| Adjusted Beta (0.67×Raw+0.33) | 1.69 | Blume adjustment |
| Equity Risk Premium | 5.0% | Developed market |
| Size / Illiquidity Premium | 0.0% | Mega-cap, highly liquid |
| Cost of Equity | 13.74% | Risk-free + adjusted beta × ERP |
| Debt Weight / After-tax Cost of Debt | 0.6% / 5.0% | 6% pre-tax cost of debt is an assumption (note coupons NOT FOUND) |
| WACC | 13.69% |
6b. Discounted Cash Flow (DCF)
| US$bn | FY2027 (H2 only) | FY2028 | FY2029 | FY2030 | FY2031 |
|---|---|---|---|---|---|
| Revenue (Full Year) | 410.2 | 683.3 | 819.9 | 885.5 | 921.0 |
| Growth | +90% | +66.6% (consensus) | +20% | +8% | +4% |
| EBIT Margin | 64.5% | 63% | 58% | 53% | 50% |
| FCFF | 108.6 | 318.5 | 376.6 | 382.1 | 379.2 |
FY2027 revenue = H1 actual US$177.8bn + Q3 guide US$108.0bn + Q4 consensus US$124.3bn; only H2 cash flow is counted because cash at 26 Jul 2026 is already in net cash. Tax 16.5%; reinvestment 15% of revenue growth; D&A 1.3% of revenue. Net cash and investments US$66.0bn (cash and debt securities US$56.6bn + equity securities US$42.8bn − debt US$33.4bn); 24,285m diluted shares.
| Case | Key differences | Perpetuity (g) | Exit EV/EBITDA | DCF value |
|---|---|---|---|---|
| Bear | FY2028 +40%, flat/down to FY2030, margin to 40% | US$76 (3.0%) | US$100 (12x) | US$88 |
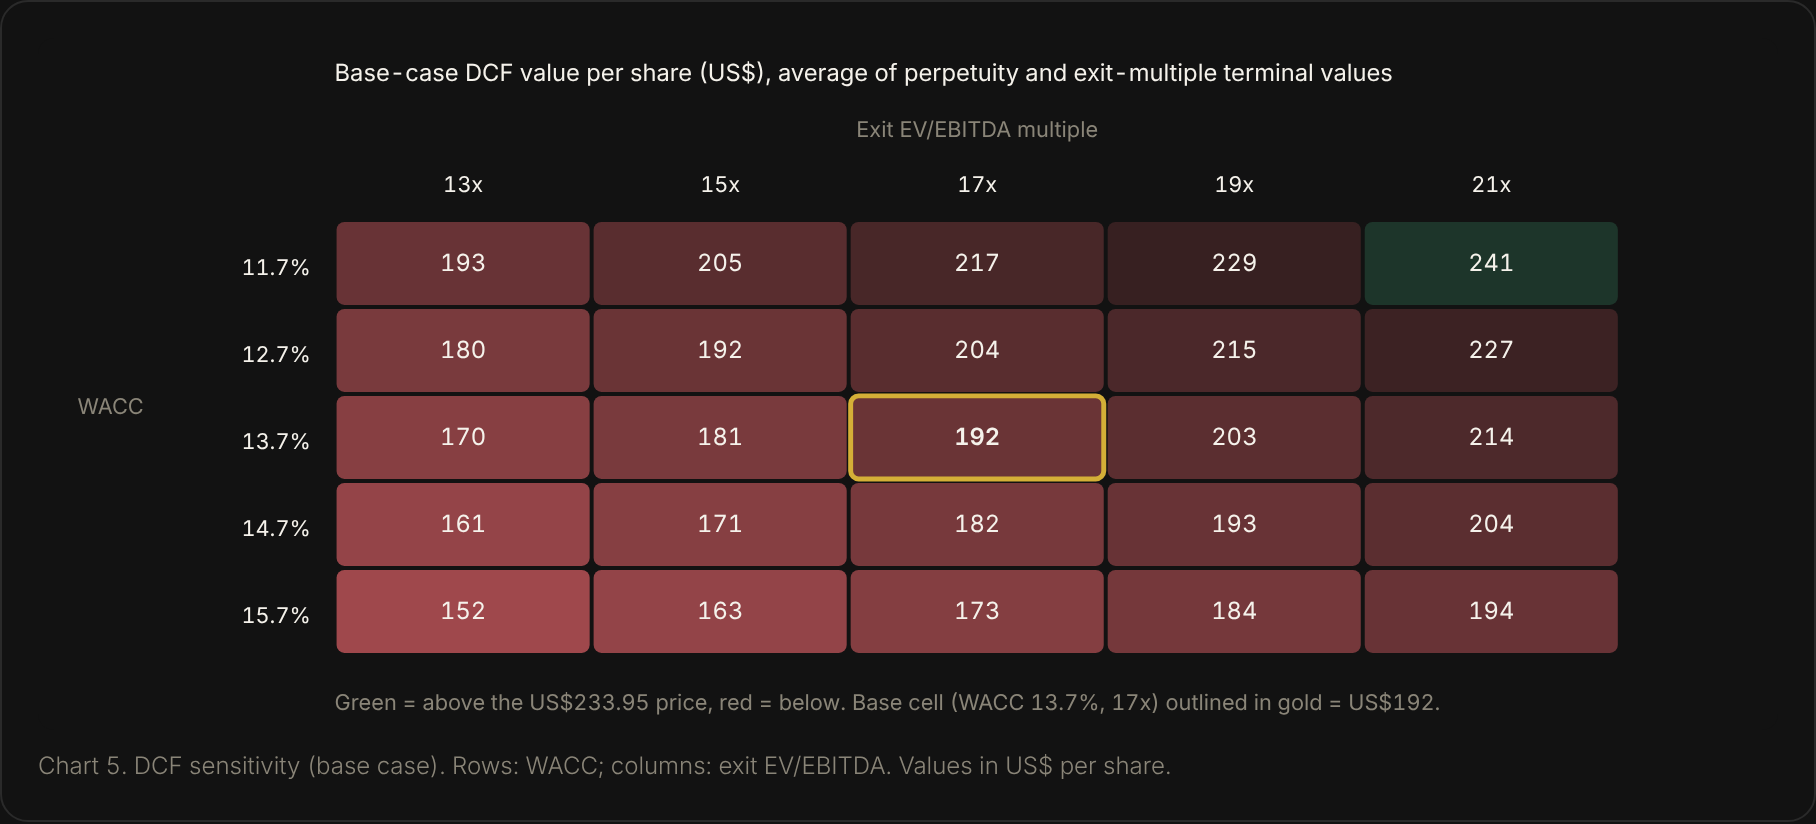
| Base | Consensus FY2028, fade to +4%, margin to 50% | US$143 (3.5%) | US$241 (17x) | US$192 |
| Bull | FY2028 +75%, +30%/+12%/+6%, margin ~58–65% | US$196 (4.0%) | US$404 (22x) | US$300 |
Implied discount rate: the base-case cash flows equal today’s price at 10.7%, versus our 13.7% WACC. The 17x exit multiple matches QCOM (17.0x) and sits below the 19.7x median of the peers growing under 35% a year (19.7x would give US$207); a 24.5x exit would be needed to justify the price on the base path.
6c. Residual Income
| FY2027 (H2) | FY2028 | FY2029 | FY2030 | FY2031 | |
|---|---|---|---|---|---|
| Net income (US$bn, model) | 125.1 | 359.4 | 397.1 | 391.9 | 384.5 |
| Residual income (US$bn) | 114.7 | 317.7 | 325.7 | 287.7 | 248.0 |
| ROE on opening book | 166% | 118% | 76% | 52% | 39% |
Opening book US$229.0bn (26 Jul 2026); payout 40% (H1 FY2027 cash returns were ~38% of net income); cost of equity 13.7%. Value with full persistence (3.5% growth): US$108; with 50% persistence: US$53; average US$80. Justified P/B at a 39% long-run ROE = (ROE − g)/(CoE − g) = 3.4x versus 24.8x today. Residual income punishes NVIDIA because almost all of its value sits in future excess returns, not in book. Shown for reference only (0% weight) — asset-light, P/B above 10x.
6d. Peers (Stockanalysis, Prices at 2 Oct 2026)
| Ticker | Price | Mkt cap | Fwd P/E | EV/EBITDA | 3-yr growth fcst |
|---|---|---|---|---|---|
| NVDA | US$233.95 | US$5.65tn | 19.4x | 28.0x | 60.6% |
| AMD | US$633.91 | US$1.03tn | 57.4x | 107.3x | 51.9% |
| AVGO | US$355.14 | US$1.70tn | 20.5x | 33.1x | 62.1% |
| TSM | US$472.78 | US$2.04tn | 20.1x | 19.7x | 34.5% |
| INTC | US$119.33 | US$627bn | 70.9x | 38.5x | 16.0% |
| MU | US$1,074.89 | US$1.21tn | 6.1x | 10.5x | 31.4% |
| QCOM | US$184.87 | US$197bn | 19.9x | 17.0x | 5.4% |
| MRVL | US$272.29 | US$239bn | 49.9x | 84.3x | 47.5% |
| ARM | US$307.49 | US$328bn | 128.8x | 305.6x | 30.0% |
Peer method: median forward P/E of peers growing under 35% a year (TSM, INTC, MU, QCOM, ARM) = 20.05x, applied to FY2028 consensus EPS of US$15.70 and discounted one year at the cost of equity = US$277. Cross-check: all-peer median EV/EBITDA 35.8x on TTM EBITDA ~US$201bn = US$300. On multiples NVIDIA looks cheap; on cash flows it does not.
6e. Single-lever Test
| Input changed alone | Low | High | Swing |
|---|---|---|---|
| FY29-31 EBIT margin -10pt/+10pt | US$158 | US$226 | US$68 |
| FY29 growth 0%/+40% | US$164 | US$220 | US$57 |
| Exit EV/EBITDA 13x/21x | US$170 | US$214 | US$45 |
| WACC ±2pt | US$217 | US$173 | US$44 |
| FY28 growth 40%/75% | US$163 | US$201 | US$38 |
| Terminal g 2.5%/4.5% | US$188 | US$197 | US$10 |
The biggest lever is the FY2029–31 operating margin: ±10 points moves the base DCF from US$158 to US$226. Readers with a different model should compare this input first.
7. Synthesis
| Method | Inputs | Value | vs price | Weight | Weighted |
|---|---|---|---|---|---|
| DCF (avg of terminal methods) | WACC 13.7%, g 3.5%, 17x | US$192 | -17.9% | 50% | US$96 |
| Residual income (reference) | Book US$229bn, CoE 13.7%, full/50% persistence | US$80 | -65.7% | 0% | — |
| Peers | 20.05x FY2028 consensus EPS (US$15.70), discounted 1 yr | US$277 | +18.3% | 50% | US$138 |
| Fair value | US$234 | +0.2% | 100% | US$234 | |
| Bear / Base / Bull | Each method re-run on its case | US$160 / US$234 / US$295 | -31.4% / +0.2% / +26.2% |
How much rests on consensus: the peer value uses Wall Street’s FY2028 EPS of US$15.70, which needs revenue up ~67%. If FY2028 revenue grows 40% instead (our bear path, EPS ~US$13.19 at the same margin), the peer value falls to US$233 and the blended fair value to about US$212 (-9%).
Method change (4 Oct 2026): an earlier draft used a 5-year beta of 2.22 (cost of equity 14.4%) and gave residual income 30% weight, for a fair value of US$180. Our rules now use a 2-year weekly beta cross-checked with peers and give residual income no weight for asset-light companies. Using NVIDIA’s own 2-year beta alone (cost of equity 13.1%) would give about US$239; the view is “Fairly valued” either way.
Margin of safety: none — the price sits on our fair value. A 30% margin of safety would mean a price of about US$164. On cash flows alone the market is using a 10.7% discount rate against our 13.7%.
8. Technicals
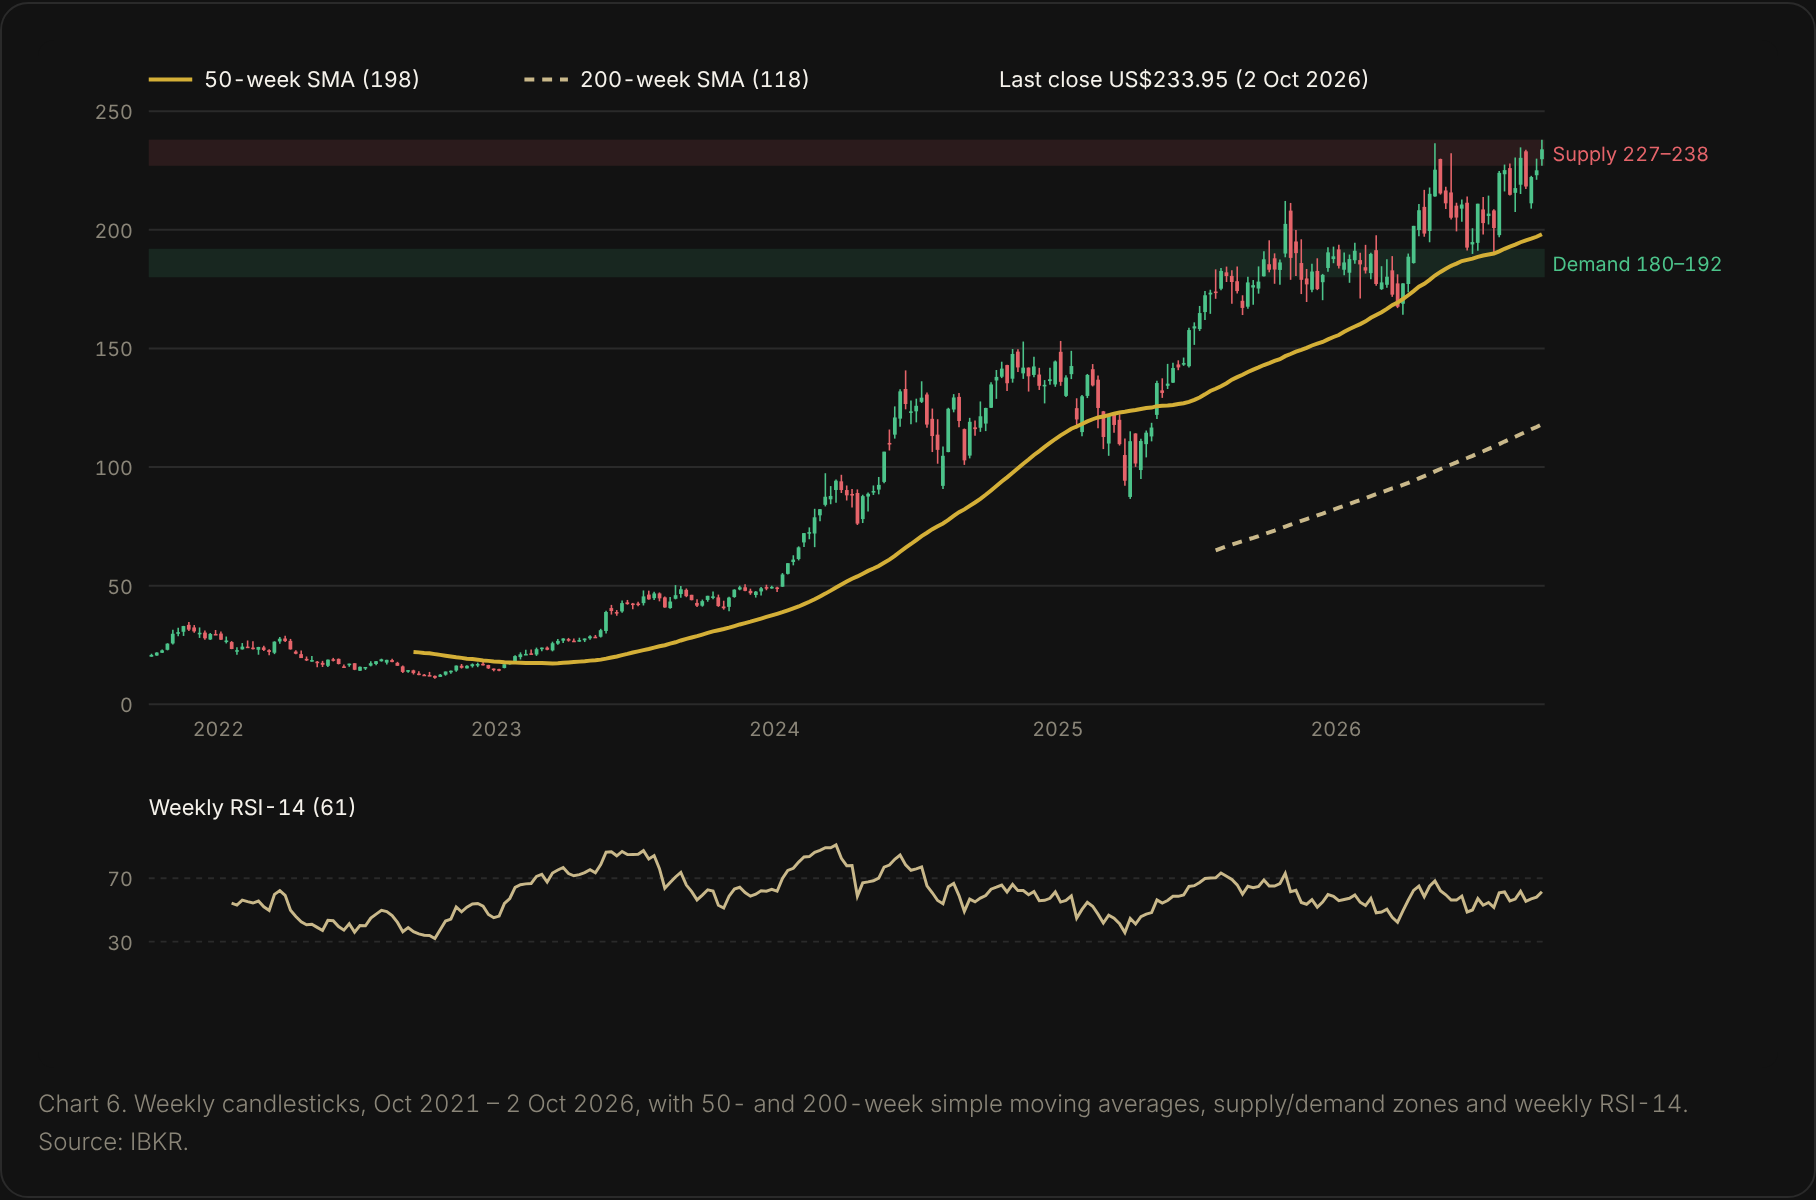
Trend: up. The close of US$233.95 is above the 50-day (US$218), 100-day (US$214) and 200-day (US$201) averages, and above the 50-week (US$198) and 200-week (US$118). The 50-day has stayed above the 200-day throughout the period the 200-day can be measured (no cross in the last year’s data). Momentum: daily RSI-14 63 and weekly 61 — firm, not overbought; the MACD histogram is positive and rising (0.83 vs 0.37 a week ago). Volatility: 20-day ATR US$5.48. The heaviest one-year volume-by-price node is US$180–188.
| Level | Price | Basis |
|---|---|---|
| Resistance 2 | US$243.81 | Weekly pivot R2 |
| Resistance 1 | US$238.88 | Weekly pivot R1 / just above the US$237.88 record |
| Current | US$233.95 | 2 Oct 2026 close |
| Support 1 | US$228.02 | Weekly pivot S1 |
| Support 2 | US$218.28 | 50-day average |
| Support 3 | US$189.86–192 | Late Jun–Jul 2026 lows; top of US$180–192 demand zone |
| Support 4 | US$164.27 | 52-week low (30 Mar 2026) |
Our Dated Calls
Pre-registered for public scoring. Price-based calls are on total return after typical trading costs (~0.1% round trip).
| # | Call | Probability | Scored on |
|---|---|---|---|
| 1 | Q3 FY2027 revenue ≥ US$108.0bn | 80% | Q3 release (17 Nov 2026) |
| 2 | Q3 FY2027 GAAP gross margin ≥ 73.5% | 75% | Q3 release (17 Nov 2026) |
| 3 | Q4 FY2027 revenue guide ≥ US$124.3bn | 60% | Q3 release (17 Nov 2026) |
| 4 | NVDA total return from US$233.95 is negative after costs | 50% | 2 Apr 2027 |
| 5 | NVDA closes below US$200 at least once | 40% | By 2 Apr 2027 |
| 6 | FY2028 consensus revenue (Yahoo) ≥ US$683bn | 65% | 1 Feb 2027 |
Bull Case
- Q3 guide of US$108bn and ~70% FY2028 growth talk point to revenue near US$700bn in FY2028.
- 75% gross margin and 66% operating margin show pricing power intact as Vera Rubin ramps.
- ~US$235bn buyback authorization equals about 4% of market cap.
Bear Case
- On cash flows, the price needs operating margins of ~62–70% through FY2031; our base fades them to 50%.
- Customer concentration (largest 16–22%) and growing in-house chips at those customers.
- US$279bn supply commitments and a US$105bn guarantee cap raise the cost of any demand pause.
FAQ
What is NVIDIA’s fair value?
Our 12-month fair value is US$234 per share (range US$160–US$295), from a 50/50 blend of our cash-flow model (US$192) and peer multiples (US$277).
Is NVIDIA undervalued?
No — we see it as fairly valued. At US$233.95 (2 Oct 2026) it trades almost exactly at our US$234 fair value. It looks cheap on multiples (19.4x forward earnings) but expensive on cash flows at a 13.7% cost of capital; the two roughly cancel out.
What are the main risks for NVIDIA?
Operating margins fading from 66% as competition and in-house chips grow, customer concentration (one customer was 16% of Q2 revenue), US$279bn of supply commitments, and China export and antitrust actions.
When are NVIDIA’s next results?
Q3 FY2027 results are scheduled for 17 November 2026 after the US close (Wall Street Horizon lists the date as confirmed). Guidance is US$108.0bn revenue.
Does NVIDIA pay a dividend?
Yes: US$0.25 per share per quarter since May 2026 (raised from US$0.01), about 0.4% a year at the current price; it also has about US$235bn of buyback authorization.
Method and sources
Fair value blends an unlevered DCF (50%, average of perpetuity-growth and exit EV/EBITDA terminal values) and a peer P/E method (50%); a residual-income model is shown for reference with no weight, because NVIDIA is asset-light (P/B 24.8x). The cost of equity uses a 2-year weekly beta against the S&P 500 from IBKR data, cross-checked with the peer median. Price and technicals are from Interactive Brokers daily and weekly bars to 2 Oct 2026. Where articles and live data disagreed, live data was used: some reports said NVDA closed up 2.9% on 2 Oct, but exchange bars show a US$233.95 close, +1.3%. Figures independently fact-checked against the linked sources on 2026-10-04; revised valuation re-checked the same day.
- NVIDIA Q2 FY2027 results (26 Aug 2026) — nvidianews.nvidia.com
- Q2 FY2027 full tables (GlobeNewswire) — www.globenewswire.com
- CFO commentary Q2 FY2027 (SEC) — www.sec.gov
- Form 10-Q Q2 FY2027 (SEC) — www.sec.gov
- Form 10-K FY2026 (SEC) — www.sec.gov
- Proxy statement 2026 (SEC) — www.sec.gov
- 8-K 17 Aug 2026, SB Energy guarantees — www.sec.gov
- 8-K 2 Sep 2026, Hugging Face — www.sec.gov
- 8-K, field operations leadership — www.sec.gov
- US$150bn buyback increase (28 Sep 2026) — nvidianews.nvidia.com
- Q2 FY2027 earnings call transcript — www.fool.com
- stockanalysis NVDA statistics — stockanalysis.com
- stockanalysis financials — stockanalysis.com
- stockanalysis quarterly — stockanalysis.com
- stockanalysis cash flow — stockanalysis.com
- stockanalysis ratios — stockanalysis.com
- stockanalysis forecast — stockanalysis.com
- Yahoo Finance analysis — finance.yahoo.com
- Peer statistics and betas: AMD, AVGO, TSM, INTC, MU, QCOM, MRVL, ARM (stockanalysis.com)
- S&P 500 list — stockanalysis.com
- US Treasury par yield curve — home.treasury.gov
- Record high, 2 Oct 2026 (Yahoo) — finance.yahoo.com
- China RTX PRO 5500 (Asia Times) — asiatimes.com
- DOJ Groq probe (Axios) — www.axios.com
- Huang Form 4, Sep 2026 (StockTitan) — www.stocktitan.net
- Insider filings Sep 2026 (StockTitan) — www.stocktitan.net
- Executive share sales, 3 months to Sep 2026 (GuruFocus) — www.gurufocus.com
- Huang completes 2025 share-sale plan (Yahoo) — sg.finance.yahoo.com
- Target raises 27 Aug 2026 (TipRanks) — www.tipranks.com
- Circular-financing selloff 27 Jul 2026 (Yahoo) — finance.yahoo.com
- OpenAI round closes (CNBC) — www.cnbc.com
- Intel stake closes (Yahoo) — finance.yahoo.com
- Q1 FY2027 results — nvidianews.nvidia.com
- Next results date (Wall Street Horizon) — www.wallstreethorizon.com
- Price history and 2-year beta: Interactive Brokers (NVDA, NASDAQ; S&P 500 index), daily and weekly bars to 2 Oct 2026
Not located: Q2 FY2027 compute vs networking split; FY2027 Gaming/Pro Viz/Automotive (no longer reported); 12-month insider sale totals; historical and implied volatility; coupon on 2026 notes (6% cost of debt assumed); frequency basis of the peers’ published betas; prior-year CEO pay; peer historical growth; exact US nominal GDP (terminal growth 3.5% is an assumption).
Analysis only, not a recommendation to buy or sell any security. Figures as at 2 Oct 2026; sources linked. The author holds a position in NVDA.
Get the next report by email
One independent, fact-checked equity research report each weekday on Singapore and US stocks, with every prediction scored in public. Free.


Leave a comment