Equity-Pulse content is for informational purposes only and not financial advice. Investments carry risk, including loss of principal. Always do your own research and consult a professional before acting.
I won’t pretend I’ve been in this name for years. I’ve only been watching SoFi closely for a few months. But even in that short time, it’s clear that something fundamental has shifted.
$20 isn’t just a number on a chart. It’s a checkpoint and a clear signal. The moment SoFi starts shedding its identity as a glorified lender and steps up as a real fintech platform. In this post, we will open the hood to understand the mechanics under the surface, what has changed and what hasn’t.
SoFi is redfining its role in fintech.
Let’s unpack this with fresh eyes, without baggage or bias. Just a clear look at where it stands and what could come next.
🧾 SOFI Quick Facts
Metric
Value
Price
$19.95
Market Cap
~$22.05 B
P/E Ratio (TTM)
~46.4×
EPS (TTM)
~$0.43
Revenue (Q1 2025)
$771.8 M, YoY GAAP +33% adjusted
Adjusted EPS (Q1 2025)
$0.06 (200% YoY growth)
Members (Q1)
10.9 M (+34% YoY)
Products (Q1)
15.9 M (+35% YoY)
Fee-Based Revenue Share
$315M in fee-based revenue (~41% of total)
Next Earnings
July 29, 2025 (After Market)
(P/E derived using annualized adjusted EPS of $0.06 × 4 = $0.24)
Why It Matters?
Transition to Capital-Light Revenue Fee-based revenue reached $315M, representing 41% of net revenue and growing 67% YoY. This is a clear signal that SoFi is shifting away from capital-intensive lending toward recurring, higher-margin income
Operational Scale & Efficiency Q1 saw record adjusted EBITDA of $210M (27% margin), up 46% YoY, demonstrating disciplined cost control and improving unit economics
Explosive User Growth Adding 800,000 new members to reach 10.9M total (+34% YoY), and 1.2M new products to reach 15.9M (+35% YoY), shows strong traction in cross-selling products
Robust Profitability GAAP net income of $71.1M with $0.06 EPS marks SoFi’s sixth consecutive profitable quarter, validating that growth isn’t coming at the expense of profits.
Heavy Tech Infrastructure Footprint 158M+ accounts on Galileo and Technisys emphasize SoFi’s potential to monetize its fintech infrastructure beyond retail customers
Confidence in the Outlook Q2 guidance calling for $785 – 805M in revenue and $0.05 – 0.06 EPS indicates management’s belief in continued momentum into 2025
🧭 How Did We Get Here?
Private Markets, Now Publicly Available
SoFi just launched what might be its most underrated move yet. You can now invest in pre-IPO names like OpenAI and SpaceX with as little as $10.
This is not a flashy headline. It is a structural change. Retail investors are getting access to private markets that were once locked behind seven-figure gates.
Will it see adoption? That is still unfolding. But the message has landed, and Wall Street is listening.
Not Just a Bank. Not Just a Broker.
SoFi has grown into something much more layered. Here’s the breakdown:
This is how SoFi’s ecosystem stacks up:
Arm
What it Does
Why It Matters
Lending
Personal & Student Loans
Solid margins, sticky revenue, and growing demand.
Galileo & Technisys
Banking-as-a-Service
Quietly powers over 158 million accounts. Core infrastructure for neobanks.
Investing
Stocks, crypto, and now private funds
Alt-market expansion adds yield and cross-sell potential.
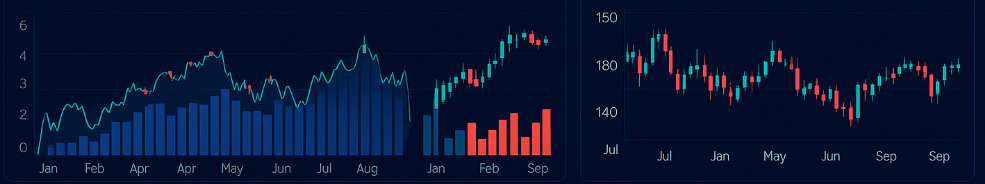
📈 The Chart Tells You… It’s Breaking Out
SoFi trades around $20.00, near multi-year highs.
98 IBD Composite Rating This means that SOFI is outperforming 98% of all other stocks in terms of key fundamental and technical strength.
RSI sits above 70, flirting with overbought SoFi’s RSI above 70 tells us the recent buying pressure has been very strong. It could be a pause point, or even signal a short-term pullback if momentum cools. For traders, this is often a warning flag to avoid chasing too late.
Heavy call flows around $20 to $25 This suggests bullish bets ahead of earnings, especially with implied volatility rising.
Volume has surged beyond 100 million High volume confirms that this rally is institutionally supported, not just retail-driven noise.
The run-up comes ahead of Q2 earnings on July 29, which now becomes the next proving ground.
🪨 A Few Hard Truths
Even good stories need guardrails. Here are four things to watch:
Valuation is no longer cheap. At $20, you are pricing in strong execution through 2026.
Earnings matter now. If SoFi misses revenue or guides lower, this could revisit $17 quickly.
Crypto is back, but uncertain. Execution and regulation are still question marks.
Student lending still matters. Macro headwinds or policy shifts could pressure core income.
⚙️ My Current Playbook
If I am Holding Common Shares
Stay long, with a mental stop below $18
Consider trimming above $22 if RSI spikes further
If I am Trading Options
Sell $18 cash-secured puts for 3 to 4 percent monthly yield
Sell covered calls at $22.50 to $23 post-earnings
Avoid naked calls until after July 29
Let others chase candles. We manage structure.
✨ Final Thoughts
SoFi has graduated. What began as a student loan refi business now sits at the intersection of banking, investing, infrastructure, and alt markets.
The $20 level is not just about price. It represents a narrative shift.
The question now is not whether SoFi can grow. It is whether it can scale at the pace the market expects. That answer will come in the next quarter.
So stay sharp. Stay flexible. And don’t confuse motion for momentum.
🗣 Let’s Talk
What do you think?
If SoFi becomes the AWS of fintech, what is fair value? $30? $50? Or has the market already priced it in?
In the last six months Circle’s CRCL has soared 509 percent, yet most investors have no clue why. Is USDC really reinventing money movement, or is the market riding a story? In this deep dive we strip away the noise to answer
Why does CRCL command a $178 share price
Can it justify that valuation
What comes next
📚 Background
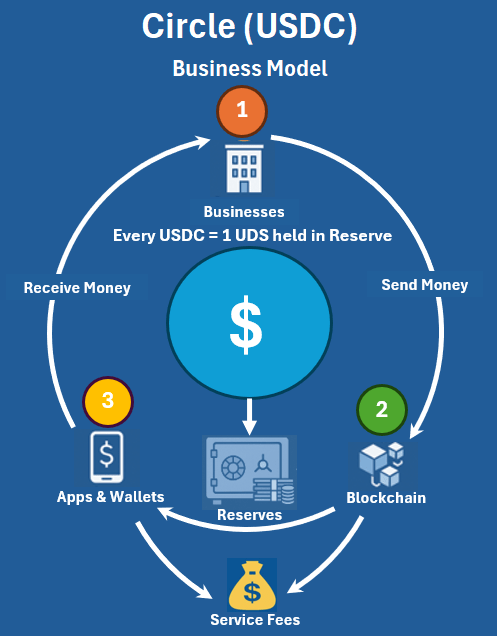
Circle issues USDC, a stablecoin pegged one-to-one to the US dollar and fully backed by cash and short-term assets. Businesses convert fiat into USDC to enable fast, low-cost transfers. Wallets and apps then hold and move USDC on blockchain networks.
Think of Circle as part bank, part payment network: it safeguards reserves like Citigroup and routes transactions like Mastercard. Circle earns fees each time it issues or moves USDC on chain. Those fees plus interest on reserves keep the peg intact and guarantee anyone can redeem one USDC for one US dollar.
⚙️ What Makes CRCL Tick?
📊 Valuations
Metric
CRCL (Circle)
Citigroup (C)
Mastercard (MA)
Market Cap
$42 b
$165 b
$517 b
P / B
56×
0.85×
77×
P / S
22×
3.2×
18×
P / E
2038.04
38×
39×
Valuations Takeaway: CRCL’s 2,038× P/E dwarfs bank multiples by an order of magnitude, underscoring an almost unbridled growth premium on USDC adoption.
Regulatory Takeaway: Strict reserve rules and partner reliance cap capital flexibility and fee diversification.
🔍 Key Insights
Circle trades at eye-watering multiples because investors bet on rapid USDC adoption and fee growth rather than legacy finance returns.
Its 58 % revenue growth dwarfs peers, yet margins and free cash flow remain constrained by one-for-one reserve backing.
On the risk side, segregated reserves and partner concentration cap deployable capital and diversification. These contrasts set the stage for our bear and bull case scenarios.
🐻 Bear / 🐂 Bull Case Scenarios
🐻 Bear Case
Trigger
Impact
Regulatory clampdown
Higher reserve ratios or capital buffers cut into fee income and FCF
P / E remains near 2,038× to reward execution and low risk
Metric
Today
Bull Case Estimate
EPS (current)
$0.0873
$0.0873 × 1.5 ≈ $0.131
P / E multiple
2 038×
~2 038×
Implied share price
$178
$0.131 × 2 038 ≈ $267
Bull math New EPS ≈ $0.131 (50 % growth) Price ≈ $0.131 × 2 038 ≈ $267
Bear and bull catalysts hinge on regulation, partnerships, market sentiment, and EPS growth rather than arbitrary multiple shifts. In the bear scenario, stricter reserve rules, partner exits, and a crypto downturn could force P / E back toward 100×, knocking CRCL to under $10. In the bull case, 50 % revenue (and EPS) growth, with the market maintaining its lofty 2 038× multiple, could lift the share price toward the mid-$200s. Mapping these triggers helps pinpoint when to scale in or trim your position.
🔮 Outlook & Speculations
In this section we forecast CRCL’s path over three horizons (short term, medium term, and long term) based on likely catalysts and market dynamics.
🕒 Short Term (1–3 months)
Catalysts: Q2 reserve audit, any SEC guidance on stablecoins, mid-sized partnership announcements
In the short term, 10 – 15 % growth could lift price into the $196 – $205 range at today’s multiple, or into $144 – $150 if multiples compress. Over the medium term, 30 – 40 % growth points to $231 – $249 at 2 038×, or $171 – $183 at 1 500×. Long term, 70 – 100 % growth with sustained high multiples could push price toward $300+, while a conservative 1 200× valuation still places CRCL near $180–$210.
✨ Final Thoughts
Circle’s CRCL sits at the intersection of cutting-edge stablecoin innovation and traditional finance, trading at an extraordinary 2,038× P/E on just $0.0873 EPS. Near-term catalysts like audit clarity and regulatory guidance could lift price into the $196 – $205 range, while long-term adoption and legislative wins might push CRCL toward $300 or more. Yet strict reserve rules, partner concentration, and extreme multiples create real downside, with a bear-case reset to 100× pricing CRCL under $10.
🗣 Call to Action
What do you think?
Can CRCL justify its current valuation, or is a multiple reset inevitable? Share your view in the comments below.
“Will Circle sustain a 2,000× P/E multiple, or is a reset inevitable?”
Following May’s sharp 22.5 percent NAV increase, June became a moment for reflection and repositioning. Rather than chase further momentum, I chose to rebalance and allocated over $7,500 into MSTY, SOFI, and a new income candidate, ULTY. Each allocation was made after careful consideration for yield sustainability, portfolio flexibility, and strategic alignment.
This decision came with trade-offs. The cash buffer narrowed to 6.6 percent, a deliberate shift in exchange for higher income potential. While MSTY continued to deliver consistent dividends and SOFI’s premiums contributed to the month’s inflows, headwinds from CONY and YMAX tempered overall returns. Still, total income reached $1,334.69, a reassuring sign that the core engine remains intact.
June was more about course correction and alignment than expansion. Each adjustment reinforced the goal of building a hybrid portfolio that balances dividend income with long-term growth. As July unfolds, the focus turns to managing liquidity, monitoring volatility, and staying anchored to strategy, especially when the temptation to overextend begins to surface.
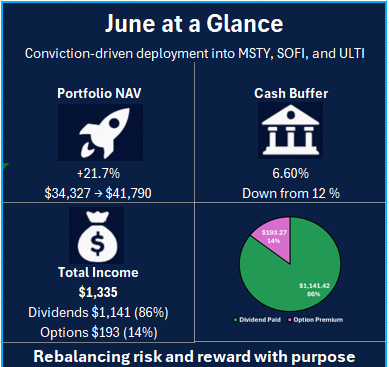
🖼️ Visual Summary
🔑Key Takeaways
Conviction Capital Deployment Over $7,500 was deployed into MSTY, SOFI, and a new income holding, ULTY. These additions reflect increased confidence in sustainable yield engines while phasing out lower-conviction assets.
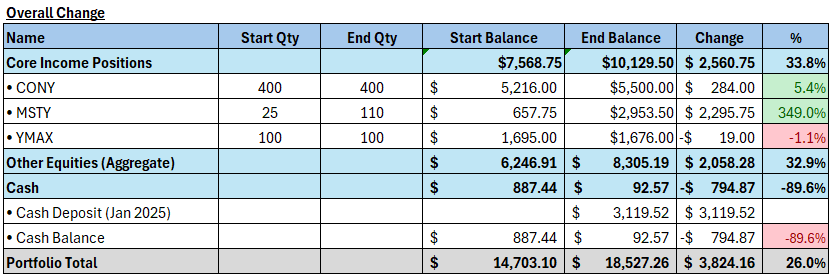
NAV Growth Maintained Despite reduced liquidity, the portfolio posted a strong NAV gain of 21.7%, ending June at $41,790.
Income Stability Preserved Total income for the month reached $1,334.69, with dividends accounting for $1,141.43 (86%) and options contributing $193.27 (14%). The mix of passive and tactical yield sources helped maintain dependable inflows.
Cash Buffer Compressed The cash position narrowed to 6.6 percent, down from 12 percent in May. This heightens exposure to liquidity risk and limits flexibility entering Q3.
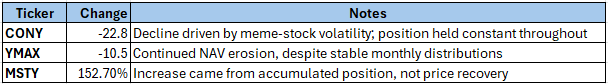
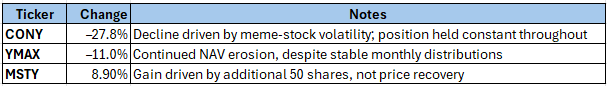
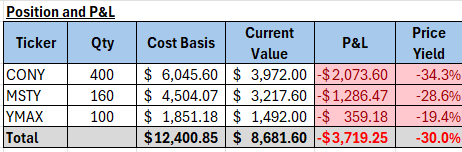
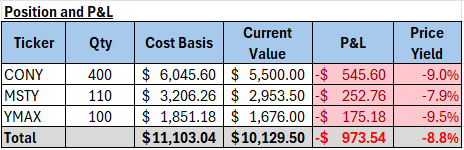
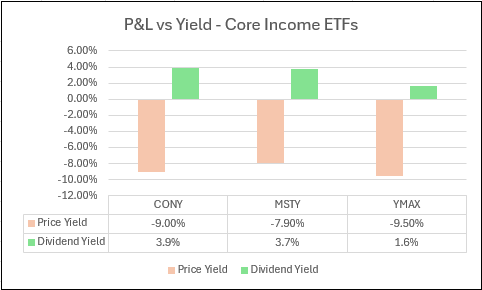
Mixed Core Performance MSTY held firm. In contrast, CONY and YMAX continued to drag, with CONY now down over 33 percent from cost.
SOFI as a Tactical Yield Engine SOFI, deployed for capital appreciation and premium harvesting, gained 11.1 percent and contributed $180.73 in options income. It continues to serve as a tactical growth and options overlay through cash-secured puts.
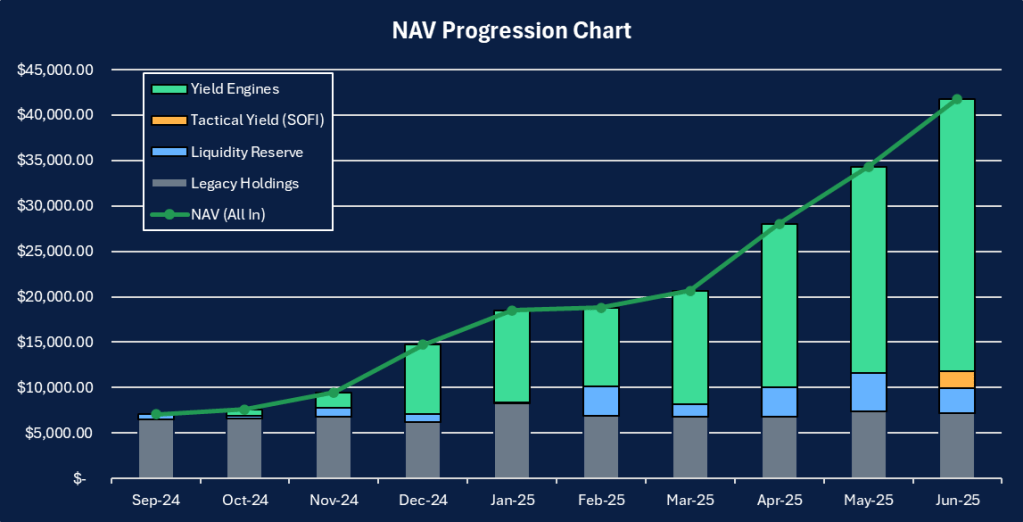
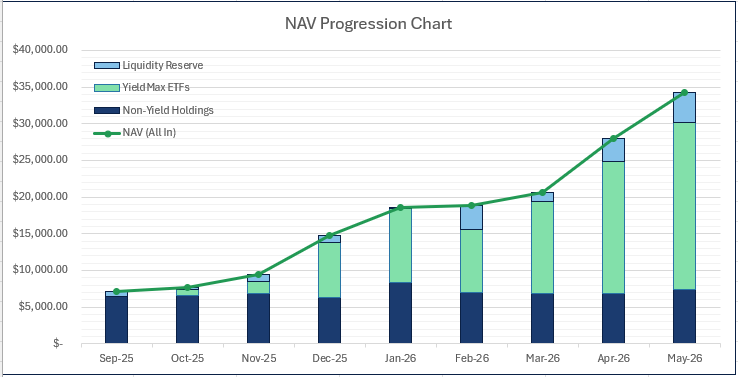
📊 NAV Progression
The portfolio rose from $34,338 to $41,790, a 21.7 percent increase driven largely by new capital allocation. Yield Engines like MSTY and ULTY continued to provide a dependable stream of income. SOFI, now separated as a tactical yield position, contributed meaningfully through both premium generation and price appreciation. The decline in liquidity to 6.6 percent reflects a conscious shift toward higher allocation and greater commitment. Legacy Holdings remain in the backdrop, serving as a reminder of where the portfolio began and how its focus has evolved over time.
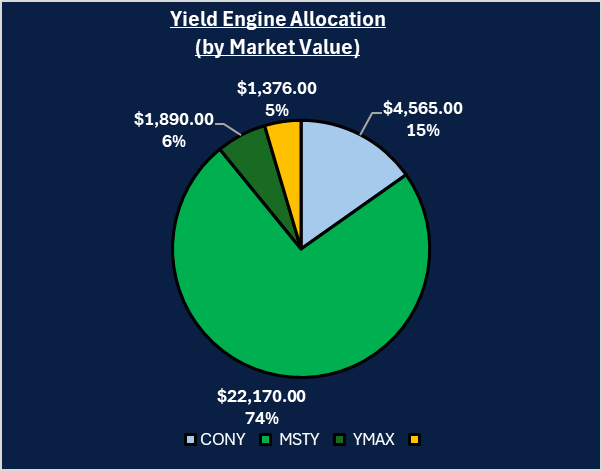
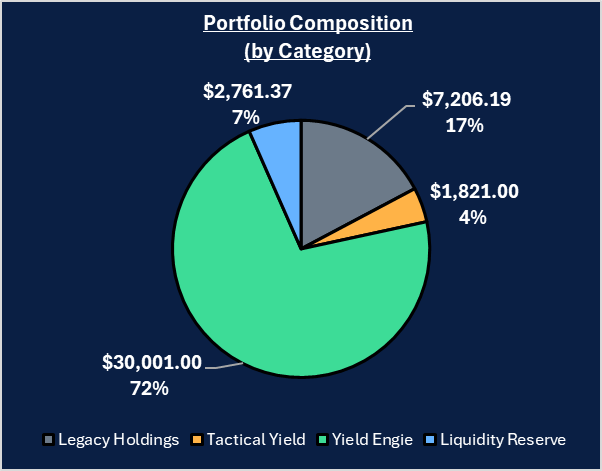
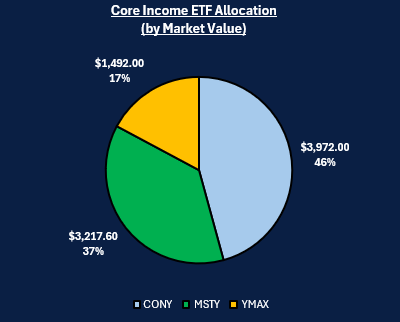
🧩Holdings
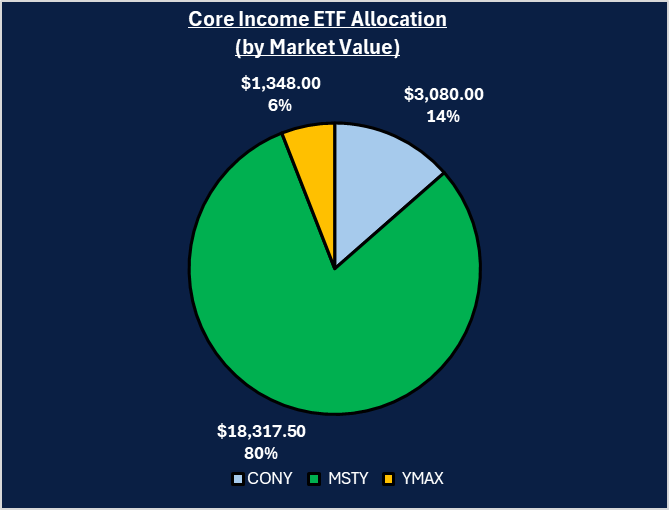
The portfolio remains deliberately concentrated, with over 70 percent of capital allocated to Yield Engines. MSTY dominates the category, representing nearly three-quarters of yield-generating capital, followed by CONY and YMAX. This reflects a continued emphasis on consistency and scale over diversification for its own sake.
SOFI is now classified separately as a Tactical Yield position. While not dividend-paying, it plays a strategic role through regular cash-secured put premiums and price movement potential. Its 4 percent weight signals both commitment and caution.
Legacy Holdings and Liquidity Reserve make up the rest, together contributing to flexibility and historical continuity. Their presence anchors the portfolio, offering flexibility while grounding newer strategic shifts.
🌐 Market Update
Volatility & Rates
Forecast in May VIX in the high teens, with a potential jump into the low 20s if CPI surprised.
Outcome in June Volatility steadily escalated throughout the month. After starting June near 17.7, the VIX climbed consistently, breaching 20 mid-month and reaching a peak of 22.51 on June 23. By month-end, it closed even higher at 24.70. This fulfilled the projection and signaled a broader market unease, likely driven by macroeconomic jitters and upcoming earnings season expectations.
For the portfolio, this shift had two direct effects:
Option premiums widened, especially on SOFI cash-secured puts and select YieldMax tickers. This made it possible to collect 11 percent yield on capital from SOFI with relatively short exposure durations.
However, rising volatility pressured NAVs across CONY and YMAX, both of which dipped modestly in price despite their high yields. This tested conviction in maintaining positions through short-term weakness.
July Outlook Volatility is expected to remain elevated as earnings season begins and key inflation and labor data are released. The VIX could stay within the 20 to 25 range, maintaining elevated option pricing. While this environment supports continued options income generation, discipline becomes more important than ever.
Expect:
Richer premiums across mid-to-high IV tickers like SOFI, MSTY, and CONY
Higher assignment risk and price swings
Greater need to protect downside and preserve cash flexibility
The key strategic takeaway: Use volatility to harvest yield, not to chase trades. Selective sizing, clear exit thresholds, and a preserved liquidity buffer (targeting at least 8 percent) will be essential for navigating July effectively.
Crypto & Equity Performance
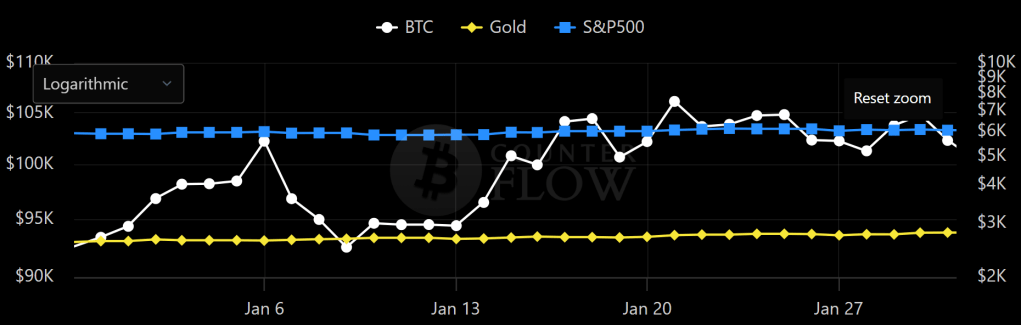
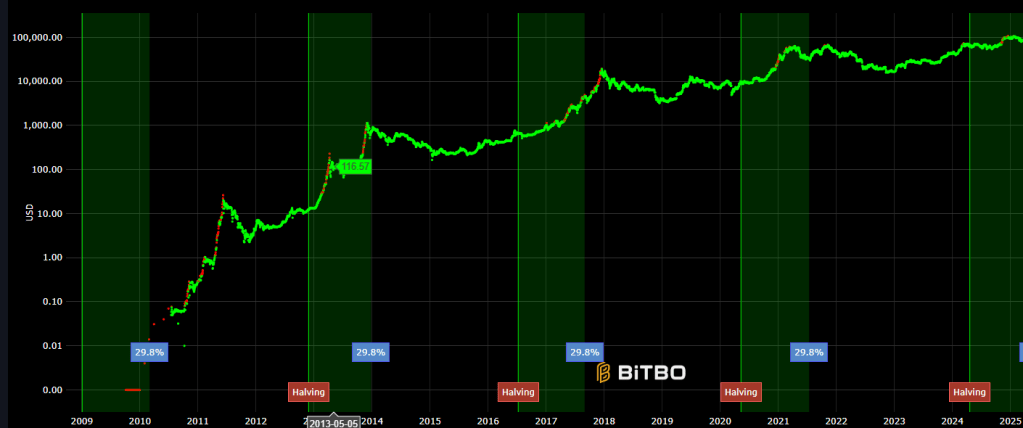
Forecast in May Bitcoin was trading slightly above 104,000, with resistance between 108,000 and 110,000, and support near 100,000 to 102,000.
Outcome in June Bitcoin tracked within expectations, oscillating between $102,000 and $111,000. After dipping to a monthly low of ~$101,000 on June 6, it rebounded and hit a high of $110,600 on June 11 before stabilizing around $107,000–$109,000. This validated the projected resistance-support channel and offered several tactical opportunities for entry and trimming, particularly for those pairing it with MicroStrategy exposure (MSTY).
Equities, especially YieldMax constituents, diverged meaningfully:
MSTY (MicroStrategy) remained resilient, supported by BTC strength, and continued to pay out robust monthly dividends.
CONY (Coinbase) and YMAX lagged, weighed down by increasing volatility and market caution, even though option IVs remained elevated.
Broader indices faced intermittent pressure, partially explaining why NAV growth in June came more from new capital deployment than organic asset appreciation.
July Outlook Crypto markets remain range-bound, but with positive skew. Bitcoin is consolidating just below resistance near $110,000, and a clean breakout could trigger rapid moves toward $115,000–$118,000. However, failure to hold above $106,000 could reopen the lower end of the channel near $102,000.
For equity-linked YieldMax names:
Expect more bifurcation — tickers tied to stronger narratives (MSTY, SOFI) will outperform others under macro pressure (CONY, YMAX).
Monitor earnings from Coinbase and other crypto-adjacent firms, which could influence July NAV swings and implied volatility levels.
Option income opportunities remain strong, but capital must be deployed selectively, with tighter stop levels and rollover readiness.
🎯Objective Review
Here’s how we performed against our June targets at a glance:
✅ Target NAV Growth of $2,000 to $3,000 — Exceeded
The portfolio rose by $7,452, far exceeding the target. This came primarily from fresh capital deployment into MSTY, SOFI, and ULTY. While organic price growth was limited due to market drag from YMAX and CONY, the strategic repositioning justified the strong NAV climb.
✅️ Income Target of $1,000 — Exceeded
Total income for June reached $1,334.69, with $1,141.69 from dividends and $193 from option premiums. Income resilience remained intact despite reduced liquidity and market volatility.
❌️ Maintain Cash Buffer of 8 to 10 Percent— Missed
Cash buffer dropped to 6.6 percent, below the lower bound of the objective. The shortfall was a calculated trade-off to pursue higher income exposure through ULTY and additional SOFI allocation. The decision elevated income potential but reduced flexibility heading into Q3.
✅️ Avoid Overextension of Options Exposure — Met
Option activity remained conservative. All trades were kept small, with premium targets met through SOFI CSPs. No margin exposure or excessive rollovers were introduced. Risk-adjusted discipline was preserved.
📁Holdings
Core Income Holdings
MSTY Continued to serve as the primary income engine. Delivered $875 in dividends, stable NAV, and consistent volatility profile. Allocation was increased as a reflection of continued confidence in yield delivery.
YMAX Yield contribution remained reliable, but price action was soft. The ETF’s tech-heavy exposure made it more sensitive to macro equity volatility. No further allocation was made in June.
CONY Price weakness persisted, with a decline pushing unrealized losses beyond 33 percent. Despite elevated premiums, new exposure was avoided due to deteriorating risk-reward.
ULTY(New Addition) Introduced in June as a new income position. Early contributions to monthly cash flow began immediately. Weekly covered calls are now being monitored for premium viability.
Tactical Overlay
SOFI Treated as a tactical growth and yield overlay. Delivered $193 in option income, with share price rising 11.1 percent. Position size and exposure were carefully managed to avoid overextension.
Other Holdings
Legacy non-yield assets were left untouched. These include older positions currently excluded from the yield strategy’s active tracking and income metrics. Visual separation has been applied in the allocation chart to distinguish these from primary positions.
🏦 Income Overview
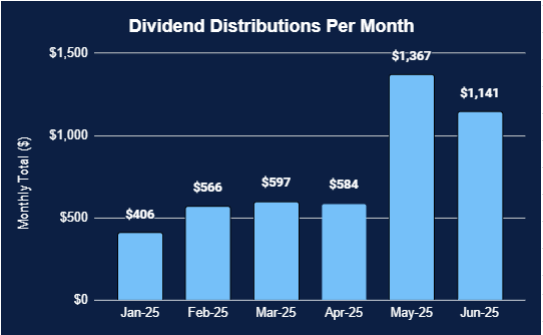
June’s income stream remained resilient, supported primarily by dividends and tactically enhanced through options. Total income reached $1,334.69, with dividends making up $1,141.43 and options contributing $193.00.
Dividend Highlights
MSTY continued to anchor portfolio cash flow, delivering $875, or roughly two-thirds of total dividends.
CONY and YMAX maintained consistent yield flows despite market softness.
ULTY, a new entrant, began contributing to income and is expected to strengthen its role in the coming months.
Option Activity
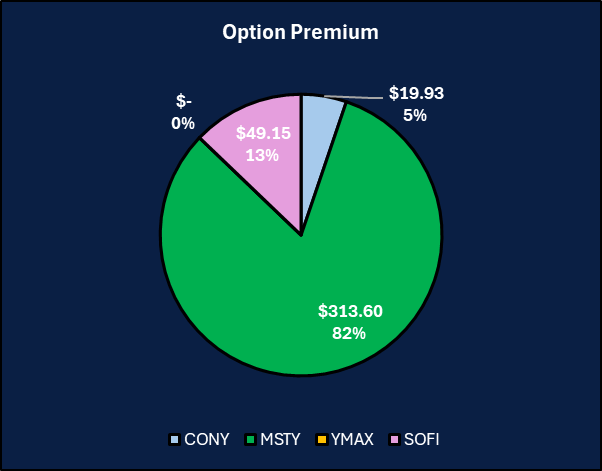
SOFI, treated as a tactical yield position, gained 11.1% and was the primary contributor to $193 in option income, with additional premiums from CONY covered calls.
No covered calls or high-risk rollouts were employed, preserving flexibility and reducing downside exposure.
Yield Profile
Overall Yield: 3.7 percent
Dividends: 3.2 percent
Options: 0.5 percent
Despite a tighter cash position and rising volatility, the income engine remained consistent. The blend of reliable dividends from core holdings and flexible premiums from tactical overlays provided a balanced, repeatable return stream.
🔭 Next Steps
July will be less about acceleration and more about stability and positioning. With a compressed cash buffer and elevated volatility, every trade must now serve a clear purpose — either to enhance income efficiency or to reinforce strategic alignment.
Area of Focus
Rebuild Liquidity While June’s deployments were necessary, the reduced cash buffer limits flexibility. Targeting a rebuild toward 8 to 10 percent cash reserves is now essential.
Watchlist Reassessment Continue to monitor ULTY, MSTY, and SOFI for additional opportunities. However, further exposure to CONY or YMAX will require a decisive reversal in price momentum or premium expansion beyond historical averages.
Avoid Forced Trades Trading discipline will remain a priority, with capital committed only when clear setups align with strategic intent.
Macro Sensitivity With earnings season and potential rate signals on the horizon, remain sensitive to macro catalysts. Expect sudden shifts in IV and equity sentiment.
This phase is about measured execution, trading only when it adds meaningful value to income, flexibility, or conviction.
📅 Month 10 Objectives
✅ Base Target
Income Goal: Generate at least $1,000 in total income
Cash Buffer: Rebuild to a minimum of 8 percent of NAV
No New Equity Buys unless buffer exceeds 10 percent
Option Selling: Focus on SOFI and MSTY only if premium exceeds 2 percent return on collateral
🚀 Stretch Goal
Total Income: Exceed $1,300, led by dividends and select SOFI CSPs
NAV Growth: Add $2,000 to $3,000 to total NAV through income and market positioning
Selective Reinvestment: Consider adding to ULTY or MSTY if premiums align and price action stabilizes
Maintain Risk Discipline: All trades must preserve flexibility, with no more than 1 CSP active at a time unless cash exceeds target buffer
These objectives continue to prioritize sustainability over speed, balancing near-term income with long-term optionality.
🧠 Final Thoughts
June offered a reminder that progress does not always come from acceleration. Sometimes, the most strategic decisions are those that slow us down just enough to realign.
The portfolio grew meaningfully, but not from windfall trades or market luck. The gains came from deliberate allocation, consistent yield harvesting, and a steady hand amid rising volatility. ULTY was added not as a bet, but as a step toward reinforcing income stability. MSTY remained the core. SOFI proved its place as a tactical overlay. Even setbacks like CONY’s continued drawdown provided clarity on what should no longer be chased.
July brings with it uncertainty, but also opportunity. The cash buffer is thinner than ideal. The market is jumpier than it has been in months. But the engine is intact. The focus now shifts to pacing — rebuilding liquidity, protecting downside, and letting income work without overextension.
If June was about course correction, then July is about maintaining altitude.
💬 Let’s Talk
Which of your holdings did the heavy lifting in June? Did you add any new positions, or are you holding back until volatility cools?
Drop your thoughts in the comments. I’d love to hear how others are balancing conviction and caution in this kind of market. Whether you’re stacking income, rotating sectors, or just sitting tight, there’s value in every approach when it’s intentional.
And if you’ve been following along for a while, thank you. Your feedback shapes how this portfolio evolves and how each post gets better.
June turned out to be a tense and eventful month on the geopolitical front. The sudden escalation between Iran and Israel drew the world’s attention. Like many investors, I found myself closely watching the developments. Partly out of concern for the humanitarian impact, and partly because I wanted to understand how these events affect my portfolio and strategy.
In this post, I will break down what happened. I will also explain what I think it means for the broader market. Finally, I will discuss how I am adjusting my game plan. This is purely my own perspective and speculation, shared in the spirit of reflection and preparedness.
Before diving into the market side of things, let’s look at a quick timeline. This will recap how the conflict unfolded and it will also show where things now stand.
🗓️Timeline: Key Events in the June 2025 Iran – Israel Conflict
13-Jun-2025 Initial Israeli Strikes
Israel launched a wave of airstrikes targeting key Iranian military and nuclear infrastructure. The attacks included sites near Isfahan and resulted in 78 deaths and more than 320 injured, mostly civilians (Reuters). These strikes marked one of the most direct engagements between the two countries in recent history.
15 to 22-Jun-2025 Iran’s response & Missile Barrage
Iran launched a large scale response involving over 400 ballistic missiles and drones directed at Israeli territory. Most were intercepted by Israel’s Iron Dome and allied defenses, though several missiles reached their targets. The most notable damage was to Soroka Hospital in Beersheba and several injuries were reported. The exchange drew international attention and calls for de-escalation from multiple governments and organizations.
21 to 22-Jun-2025 US Military Involvement
The United States conducted targeted airstrikes under Operation Midnight Hammer, aimed at Iranian sites identified as strategic military assets.
Iran subsequently launched missiles against US military installations in the region, including a base in Qatar. All incoming missiles were intercepted, and no casualties or structural damage were reported.
This marked the first direct US military involvement in the June escalation.
23-Jun-2025 Ceasefire Announcement and Conditional Pause
US President Donald Trump publicly announced a ceasefire. He stated that both Iran and Israel had agreed to halt hostilities.
Iran indicated it would suspend further action if Israel ceased air operations by 4 a.m. Tehran time. Active hostilities have decreased since. However, Iranian officials noted that no formal ceasefire agreement had been signed. The situation remains subject to change.
🌍Broader Market Implications: A Neutral View
From an investment perspective, the events in June introduced a temporary spike in volatility across multiple asset classes. While market reactions were notable, they remained relatively contained.
Market Volatility was Temporary
Equity markets experienced a brief pullback mid-month, accompanied by a rise in volatility indices (VIX). Brent Oil prices moved above $75 (+13%) during the peak of the conflict, but have since stabilized.
Energy Sector Sensitivity Remains Elevated.
The potential disruption in the Strait of Hormuz raised short-term concerns around global oil supply. Although no interruptions occurred, the situation reaffirmed the energy sector’s vulnerability to geopolitical shocks.
Select Sectors Saw Defensive Strength
Companies linked to defense, Cyber-security and AI, such as Nvdia, saw modest gains amid the conflict. While I have only minor exposure to these sectors, I noted their potential role during periods of heightened geopolitical risk.
💼Portfolio Assessment: Adjustment and Priorities
I have made no immediate changes to my holdings. However, the situation provided a useful moment to reassess positions. It also gave me a chance to rethink short term strategy.
✅ Positions that I am Maintaining
YMAX & ULTY
These remain steady income generating assets. Their performance was largely unaffected by geopolitical developments and they help offset volatility from more growth-oriented holdings.
MSTY
MSTY’s US centric large cap exposure and dividend focus makes it relatively insulated from international conflicts. No adjustment needed here.
NVDA
The longer term outlook remains positive, particular as AI and defense related technologies continue to draw interest.
⚠️ Positions that Need Close Monitoring
SOFI, PLTR, NET
These higher beta growth names are more exposed to changes in market sentiment. I am not adding to them at the moment and will reassess if conditions stabilize. I will also reconsider if premiums on short puts become attractive.
CONY
As an Option Income ETF with exposure to tech, CONY is moderately sensitive to broader market volatility. During the June VIX spike, call premiums improved. This provides an opportunity to consider writing additional covered calls. For now, I am holding and watching option setups more actively.
📝Tactical Observations
Energy and Gold Remain Relevant
The market’s reaction to Hormuz risks and gold demand reaffirmed their role in global asset allocation. I do not hold these directly. I am however, evaluating whether adding a small commodity or gold ETF would offer a layer of strategic diversification.
Options Opportunities in Elevated Volatility.
June option premiums spiked temporarily. For those comfortable with cash secured puts, this offers a chance to earn outsized premiums during market uncertainty.
🎯Final Thoughts
The June conflict served as a strong reminder that geopolitical developments can reshape short-term market dynamics in unexpected ways. Though the ceasefire appears to be holding, tensions in the region remain a potential source of future volatility.
For now, I am staying the course. I am building long-term exposure to crypto, and am maintaining income-generating positions. I am also selectively considering additions in commodities or defense if conditions warrant. Meanwhile, I will also watch macro signals such as oil and gold prices more closely than usual.
If regional events intensify, or if markets begin to price in sustained commodity inflation, I will be ready to adjust. Until then, my focus remains on fundamentals, flexibility and staying informed.
If you’re navigating similar income strategies, I would love to hear how your portfolio responded to the June volatility. Please share your experience. Are you adjusting your exposure, locking in premiums, or simply staying the course?
Let’s compare notes. Staying informed is half the game. The other half is knowing when not to move.
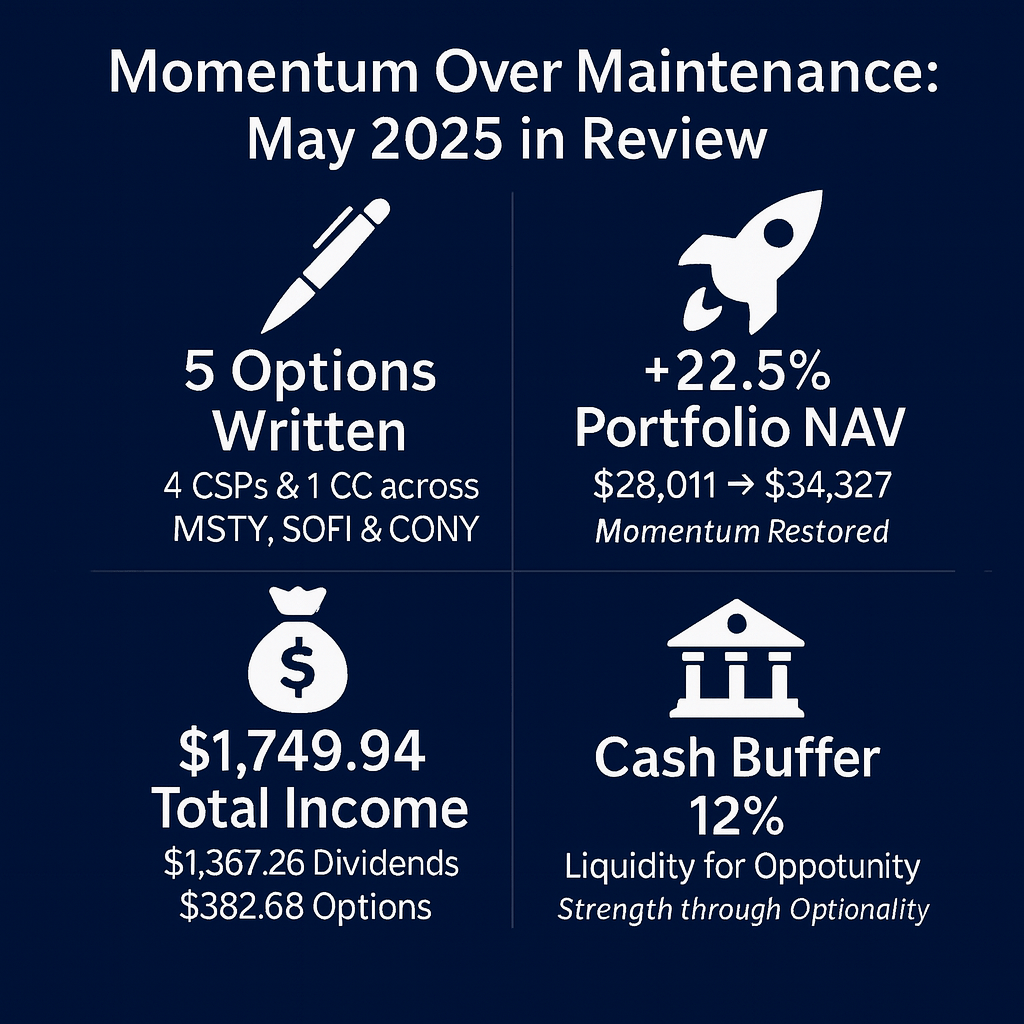
In May 2025 our portfolio delivered a 22.5 percent NAV gain, driven by $382.68 in option premiums (a 4.7 percent yield on collateral) and an 11.1 percent Bitcoin rally. The cash buffer expanded to 12 percent, providing flexibility to pursue high conviction income trades. In this report we unpack the key performance drivers and outline our strategic plan for the month ahead.
🖼️ Visual Snapshot
🔑Key Takeaways
NAV Growth: Up 22.5 percent, rising from $28,011 to $34,327
Option Income: $382.68 collected, yielding 4.7 percent on collateral (1.4 percent on NAV)
Dividend Income: $1,367.26 received, equating to a 4.9 percent yield
Combined Yield: Total income reached 6.3 percent for May
Crypto & Volatility: Bitcoin rallied 11.1 percent while VIX fell from 23.94 to 18.57
Cash Buffer: Expanded to 12 percent of portfolio, enhancing optionality
📊 NAV Progression
In May our NAV climbed from $28 011 to $34 327, a 22.5 percent increase. Cash rose from $3 207 to $4 207, while core income ETFs and satellite equities together contributed the remaining $6 109 of growth. This jump was powered by elevated option premiums, dividend income and a strong crypto rally.
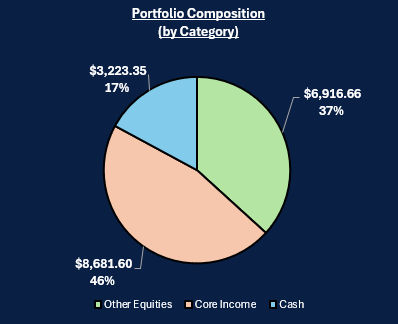
🧩 Portfolio Composition
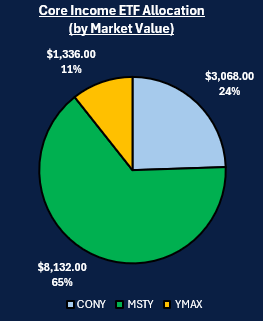
Core Income ETF Mix: MSTY dominates at 80%, CONY holds 14% and YMAX 6%
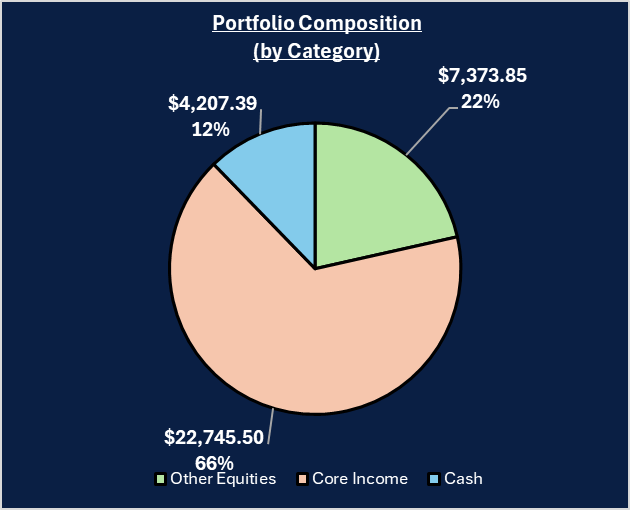
Overall Portfolio: Core income ETFs account for 66%, satellite equities 22% and cash 12%
The tilt toward MSTY reflects our focus on high-IV option premiums, while satellite equities provide growth ballast
🏦 Core Income Review
Option Activity
In May we wrote four cash-secured puts and one covered call, collecting $382.68 in net premiums. Measured against the $8 100 of total collateral posted for these puts, this delivered a 4.7 percent yield on collateral (and a 1.4 percent yield on NAV). We’ll unpack the detailed trade-by-trade breakdown and collateral usage later in this section.
We added SOFI to our watchlist and sold the 13.00 put because its post-earnings IV spiked above 50% and its balance sheet supports a low risk of assignment.
Income Activity
Dividends once again powered our income engine, generating $1,367.26 and delivering a 4.9 percent yield on core positions. Combined with option premiums, total income yield for May reached 6.3 percent. Detailed dividend contribution by ticker follows below.
🌐 Market Update
Volatility & Rates
Fed commentary remained “patient” on further rate hikes, supporting yield-sensitive assets
The VIX fell from 23.94 to 18.57, signaling easing equity market fear
Crypto & Equity Performance
Bitcoin rallied 11.1 percent, climbing from $94 169.39 to $104 638.09 in May
Volatility: With VIX hovering in the high teens, option premiums should stay elevated. A surprise in upcoming CPI data could push VIX back toward the low-20s
Crypto Momentum: Bitcoin now sits just above $104 000. Watch resistance at $108 000–$110 000 and support near $100 000–$102 000 for potential entry/exit triggers
YieldMax ETFs: Implied volatility across CONY, MSTY and YMAX remains richer than broader equity indices. We expect continued opportunity to write cash-secured puts and covered calls at strikes 5–10 percent out-of-the-money, targeting 2.5 percent premium income per month depending on IV levels and available collateral
🎯 Objective Review
Here’s how we performed against our May targets at a glance:
✅ Rebuild Cash Buffer — Carry Over
Our goal was to maintain a cash buffer above 11 percent of NAV. In May we exceeded this target, lifting the cash buffer to 12 percent. This extra liquidity reinforces optionality, allowing us to patiently wait for compelling equity or option opportunities without fear of being undercapitalized.
⚠️ Reassess Underperformers — Active
We set out to monitor YMAX for further weakness and to hold CONY if it showed stability. YMAX remained structurally weak but we chose not to trim, instead opting to observe for a clearer breakdown. CONY delivered minor signs of recovery, validating our decision to maintain the position for another month.
⚠️ Stay Selective With Options — Watchlist Active
The plan was to sell cash-secured puts or covered calls only when weekly premiums exceeded 2.5 percent of collateral. All four MSTY puts and the single CONY call achieved yields between 3.7 percent and 5.3 percent, comfortably surpassing our threshold and confirming the effectiveness of our watchlist discipline.
⚠️ Monitor BTC–MSTY–MSTR Correlation — Ongoing
We aimed to see whether MSTY and MSTR would move in step with Bitcoin without fresh capital injections. While Bitcoin rallied 11.1 percent, MSTY and MSTR both declined (–4.3 percent and –5.9 percent respectively), suggesting some decoupling remains. We’ll continue to assess this relationship before reallocating further.
✅ Income Target $400+ — Exceeded
We updated our dividend income framework to a $500 base goal with a $1,000 stretch target in high-volatility months. In May we collected $382.68 in option premiums and $1,367.26 in dividends, for a combined $1,749.94. This performance surpasses both the new base and stretch goals. We will review these thresholds quarterly.
✅ Stretch Goal — Targeted SOFI Entry via CSPs
We planned to write SOFI cash-secured puts once IV exceeded 45 percent and weekly premiums topped 2.5 percent of collateral. In May we sold one SOFI 13 put, earning a 3.7 percent yield while keeping the cash buffer above 10 percent. This stretch goal checklist was fully met.
📘 Next Steps
Lessons & Strategy Rationale
Concentrated Option Income Works Focusing on MSTY when its implied volatility spiked delivered outsized premiums. Writing three MSTY puts at varying strikes captured higher yields than diversifying across lower-IV ETFs.
Cash Buffer Is Optionality Maintaining 12 percent cash proved valuable. It allowed us to avoid forced trades and wait for premiums that met our criteria. Liquidity grants the power to pick and choose higher-conviction opportunities.
Satellite Equities Smooth Returns Adding and holding non-income equities like PLTR and other satellites contributed 7.8 percent of growth. This diversification helped offset drawdowns in CONY and MSTY’s NAV during market weakness.
Income Framework Needs Flexibility The dual-tier $500-$1,000 goal aligns with market regimes. May’s strong performance hit the stretch target, but a $500 base ensures discipline when volatility normalizes.
📅 Month 8 Objectives
As we head into June, our overarching strategy is to build on May’s strong momentum while maintaining disciplined risk management and liquidity. We will prioritise high-conviction option trades when premiums justify the collateral, protect our cash buffer to preserve optionality, and continue blending steady dividend income with targeted crypto accumulation. This balanced approach aims to drive incremental NAV growth without compromising flexibility.
NAV Growth Aim for a 3 percent to 5 percent increase, moving NAV from $34 327 toward $35 300–$36 000
Option Premiums Collect at least $200 in net premiums, targeting a 4.5 percent to 5 percent yield on collateral
Dividend Income Generate $1,000 in dividends (≈3.6 percent yield on core holdings cost)
Cash Buffer Maintain between 8–10 percent of NAV (≈$2,750–$3,430)
🧠 Final Thoughts
As we move into June, the foundation laid in May puts us in a position of strength. Our dual‐tier income framework and reinforced cash buffer allow us to be both opportunistic and disciplined. Elevated volatility still offers rich option premiums, while steady dividends and crypto momentum underpin NAV growth. By adhering to our targets and staying vigilant on market signals, especially VIX levels and BTC–ETF correlations, we can capture upside without overcommitting capital. Here’s to carrying forward this momentum with clarity and confidence.
💬 Let’s Talk
Drop your thoughts in the comments. Let’s refine the playbook together — one trade, one lesson, one honest review at a time.
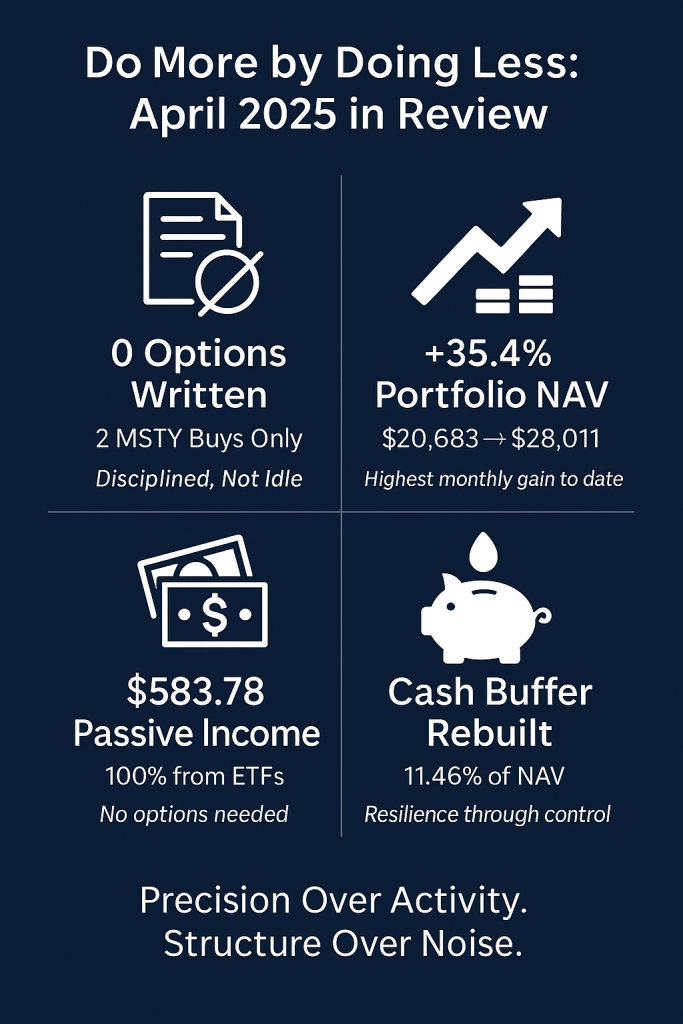
April 2025 portfolio review kicked off with the strongest NAV gain since inception in September 2024.
The portfolio rebounded 35.4%, rising from $20,683.07 to $28,011.26, proof that disciplined timing and core positioning paid off.
Option Activity
No options were written once again. Implied volatility crept higher, yet premiums across the YieldMax suite still failed to justify re-entry. The bar held.
Income Activity
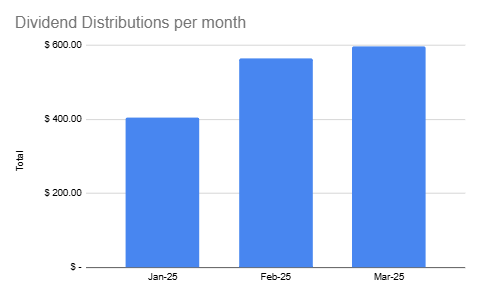
Dividends did the heavy lifting. The portfolio collected $583.78 in passive income, matching March’s total and proving that the yield engine remains intact even in the absence of option flow.
Key take-aways from April
This wasn’t a flashy month.
It was a functional one.
Capital grew. Income held.
The portfolio,is beginning to lean forward again.
🎯 Objective Review
Here’s how we performed against our April targets at a glance:
✅ Rebuild Cash Buffer — Achieved
April began with $1,334.87 in cash and closed at $3,209.31, lifting liquidity to 11.46% of NAV, surpassing the 10% target. This rebound was especially notable considering the $3,245.79 deployed across two staggered MSTY buys: 50 shares at $19.50 on April 7 and 100 shares at $22.70 on April 24. Liquidity was not restored through idleness. It was rebuilt through deliberate pacing, steady dividend inflows, and disciplined capital deployment.
⚠️ Reassess Underperformers — In Progress
YMAX and CONY remain in the spotlight. YMAX continued its capital decline with minimal dividend support. CONY, however, showed early signs of stabilization, but not enough to remove its watchlist status. No exits were made, but deeper evaluation has begun. The decision window is narrowing.
⚠️ Stay Selective With Options — Deferred
No covered calls or cash-secured puts were executed in April, including on SOFI. Despite elevated VIX levels (rising from 22.06 to 24.70), actual premiums across core holdings (MSTY, CONY and YMAX) remained below the 2.5% threshold required for entry. The strategy of restraint continued. No trades were forced. The bar held firm.
⚠️ Monitor BTC–MSTY Correlation — Mixed
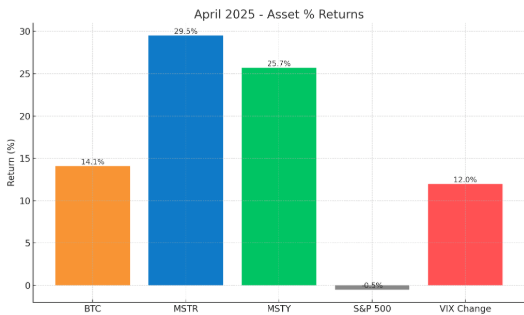
Bitcoin rallied 14.1% in April, signaling renewed strength across the crypto sector. MSTY tracked reasonably well, rising 25.7%. This was a sign of improving structural responsiveness. However, the move was aided heavily by fresh capital infusion rather than pure NAV expansion. While MSTY’s NAV did trend upward alongside its proxy, MicroStrategy (+29.5%), the need for continued vigilance remains. Responsiveness has improved but is not yet consistent.
✅ Income Target $400+ — Exceeded
Total income reached $583.78, entirely from dividends. No CSPs or calls contributed meaningfully to income, yet the portfolio cleared its monthly goal with margin. This affirms the strength of the dividend engine, even as the premium environment stays muted.
📌 Summary
April was a re-centering. Liquidity returned. Income held.
Trades were sparse but intentional. Underperformers were left untouched, but not ignored. The portfolio enters May with optionality intact and a structure geared for resilience over reach.
📊 Market Update
Equities Recap:
S&P 500 returned -0.5% in April
Market breadth remained narrow
Large-cap tech continued to hold up, but cyclicals softened.
Crypto Sector
Bitcoin surged +14.1%, It’s strongest month since January.
MicroStrategy rose +29.5%., restoring correlation strength
MSTY followed with a +25.7% rebound
Volatility Signals
VIX rose from 22.06 to 24.70
Implied volatility increased across the board
However, premiums across MSTY / CONY / YMAX did not propotionately expand.
Interpretation
Volatility returned, but income opportunities stayed limited.
Strong crypto gains did not spill over into option yield recovery
A silent test of conviction rather than a trading bonanza.
🏦 Core Income Review
April delivered a powerful rebound across the portfolio’s income-generating base. Core holdings ( MSTY, CONY, and YMAX) appreciated from $12,536.00 to $17,959.00, marking a +43.3% portfolio-level surge. This growth was driven primarily by MSTY’s explosive performance, with more muted contributions from the rest.
MSTY was the undisputed growth engine. Two well-timed buys expanded the holding from 400 to 550 shares. The result was a $5,255.00 increase in value, eclipsing the gains from all other components combined.
CONY showed marginal improvement, reversing some of its prior decline, but remains under close watch due to fragile capital structure and volatility sensitivity.
YMAX once again faltered. The ETF lost ground on both yield and value. Its continued weakness raises serious questions about long-term role in the income sleeve.
Yet despite the imbalance, dividend income from core income ETFs held steady at $583.78, matching March’s total. A testament to income durability even as capital values diverged.
🚀 Growth Holdings
April brought a quieter month for non-YieldMax positions. These equities, often held for asymmetric upside or strategic diversification, contributed modestly to overall NAV growth. The aggregate value rose from $6,812.20 to $6,842.95, a marginal gain of $30.75 (+0.5%).
This steady line reflected the absence of major moves or new capital deployments in these holdings. Unlike the explosive returns from MSTY, the satellite group served more as ballast, providing portfolio breadth but little in terms of direct performance lift.
No trades were executed within this segment during April. The lack of movement was intentional. With market breadth narrowing and option premiums staying muted, the satellite sleeve was left untouched to preserve flexibility.
No capital growth or speculative holdings were active this month. Portfolio remained focused on income generation and liquidity preservation.
💰 Income Performance
April extended the portfolio’s income momentum, delivering a total of $583.78 in passive income, identical to March’s total. Despite the absence of option trades, income held steady, supported entirely by ETF dividends.
This outcome once again reinforces the durability of income flows, even during months with reduced market activity or fewer tactical moves. The portfolio’s structural emphasis on high-yield instruments (e.g., CONY, MSTY, YMAX) once again proved its reliability in funding passive growth.
Highlights
No covered calls or cash-secured puts were executed during April.
The YieldMax suite remained the primary engine for dividend income.
Income met the portfolio’s recurring $400/month target, reaffirming its baseline strength.
Despite limited activity, income remained stable and entirely unassisted by derivatives. A reflection of both careful ETF selection and a structurally sound income foundation.
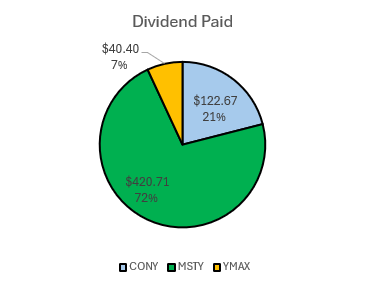
📊 Income Composition
MSTY: $420.71 (72%)
CONY: $122.67 (21%)
YMAX: $40.40 (7%)
📘 Next Steps
April reinforced a vital truth often forgotten in high-churn markets: patience, discipline, and structural integrity outperform urgency.
Key Lessons:
Income Engine is Robust $583.78 was achieved with zero options deployed. The passive income base is sustainable,even in muted markets.
Selective Action Outperforms Forced Trades With MSTY buys carefully paced and no CSPs forced, the portfolio grew without stress-testing liquidity. Every trade had purpose.
NAV Expansion Can Be Decoupled from Activity Despite minimal trading, NAV grew 35.4%. The core holdings did the heavy lifting.
Correlations Require Ongoing Monitoring MSTY’s tracking of MSTR and BTC improved, but was aided by fresh capital. This calls for continued diligence, not complacency.
Underperformance Needs Structure, Not Emotion YMAX was left untouched, and rightly so. No rash exits. But it remains a problem child in need of decisive criteria.
Looking Ahead to May:
Structure Holds Priority There is no rush to deploy. Cash remains above 10%, affording flexibility.
Re-evaluate Watchlist Holdings YMAX and CONY remain under review. Decide: hold with conditions or trim.
Monitor Premiums A VIX above 24.7 should bring opportunity. But entries will only occur if return thresholds exceed 2.5%.
Optionality Overreach Let conviction trades emerge naturally. MSTY remains the engine, but new positions must earn their entry.
📅 Month 8 Objectives
May builds on regained footing. With liquidity restored and NAV sharply higher, the focus now shifts from repair to readiness. No urgency to act, but conditions call for active observation and agile response.
Preserve Cash Buffer — Carry Over Liquidity now sits above 11% of NAV. This must be protected. No new equity buys unless value emerges or options justify entry. Capital is optionality. Optionality is strength.
Reassess Underperformers — Active YMAX remains structurally weak. No changes yet, but further decline may trigger a trim. CONY showed flickers of recovery. Another stable month may justify a hold.
Stay Selective With Options — Watchlist Active IV is back, but still uneven. Monitor MSTY and CONY for premiums exceeding 2.5% of collateral. Strike only when reward-to-risk sharply favors entry.
Monitor BTC–MSTY–MSTR Correlation — Ongoing Last month restored some alignment, but attribution came partly from capital injection. May must confirm whether structural responsiveness holds even without fresh buys.
Target Income: $400 Minimum — Maintain The $400/month baseline remains unchanged. April hit $583.78 with zero trades. Let the ETFs work. But be ready to supplement with CSPs if volatility improves.
Stretch Goal — Targeted SOFI Entry via CSPs Commence SOFI option activity if the following conditions are met:
Implied Volatility (IV) > 45% driven by earnings anticipation or sector rotation
Premium exceeds 2.5% of collateral per week
Strike price aligns with conviction buy zone (i.e., below $14.00)
Cash buffer remains above 10% post-trade
🧠 Final Thoughts
April was proof that sometimes, less truly is more.
With only two equity buys and zero options sold, the portfolio grew nearly 36%. Not by chasing volatility, but by respecting it. The rebound was driven by MSTY’s recovery, BTC momentum, and a disciplined approach to capital deployment. Even as the VIX climbed and market breadth thinned, the portfolio stood its ground.
The lesson? You don’t always need action to see progress.
Cash reserves were rebuilt. NAV broke above $28K for the first time. Income exceeded target. And no positions were trimmed or forced. The machine didn’t just hold. It strengthened.
That said, fragility remains. CONY and YMAX continue to underperform. BTC-MSTY correlation must still be monitored. And income remains heavily reliant on a few levers. This is not the time for complacency. It is the time for calibration.
Month 8 sets the stage. Not for expansion — but for evolution.
💬 Let’s Talk
April asked for patience. Now it’s your turn to share:
Have you ever had a month where inaction outperformed activity? What did you learn from it?
With YieldMax ETFs delivering uneven results, how do you manage laggards? Do you trim, hold, or rotate?
Is cash your safety net or a wasted opportunity in this environment?
If you could only keep one ETF through the next quarter, which would it be, and why?
Drop your thoughts in the comments. Let’s refine the playbook together — one trade, one lesson, one honest review at a time.
March was a lesson in restraint and reward. The portfolio rebounded 9.9%, rising from $18,821.61 to $20,683.07, even as option income flatlined and volatility remained muted. This was not driven by haste. It was conviction. A deliberate decision to to dollar cost average despite of prior pain.
The most significant shift came from MSTY. A disciplined reentry plan consisting of three staggered purchases between March 7 to March 10 was made. There was no chase, no panic, just a methodical accumulation at improved prices. That position now stands at 400 shares, with a recalibrated cost baseand a clear upside potential.
Other core exposures lagged. CONY bled nearly 23% despite quantity held steady. YMAX, once again, underdelivered on both capital and income fronts.
No options were written this month. With implied volatility compressed, premiums failed to meet the bar.
March was about rebuilding. It favored patience over activity, conviction over reaction. Follow through was needed, and the portfolio delivered.
Month 6 Objective Review
We entered February with 5 clear mandates: To preserve liquidity, deploy only high-conviction CSPs, monitor Core Income Divergence, stabilize NAV and meet the $400 income threshold. Here’s how the month measured up.
✅ Rebuild Liquidity — Achieved Despite expanding MSTY holdings by 240 shares, cash levels were managed carefully, ending at $1,334.46 or 6.45% of NAV. While slightly below the original 10% buffer, the buys were staggered, strategic, and timed with portfolio inflows. Optionality was preserved without overreaching.
⚠️ Selective Option Selling — Deferred No CSPs were entered. Premiums across YieldMax ETFs remained compressed for most of March, offering insufficient risk-adjusted return. The 2.5% target yield was not met, and discipline held. This was intentional absence, not missed opportunity.
⚠️ Monitor Core Income Divergence — Mixed Progress MSTY showed signs of recovery, aided by active position cost-averaging. CONY, however, continued to slide, posting a 22.7% decline in capital value with no dividend offset or corrective trade. The structural gap between the two widened, and future rebalancing may be required.
✅ Stabilize NAV — Achieved NAV rebounded 9.9% from $18,821.61 to $20,683.07, reversing February’s steep losses. This recovery was led by MSTY’s partial rebound and improved market breadth, not from aggressive repositioning. Stability returned, but only where conviction was clear.
✅ $400 Income Target — Exceeded Despite the lack of premium income, March delivered $583.78 in dividends alone, largely from MSTY and CONY. Total income exceeded target without relying on option exposure, a positive signal for the portfolio’s base yield resilience.
Deposits
Total Cash Deposit – $2,629.52
March saw a fresh deposit of $2,629.52, a continuation of the February rebuild.
The additional capital was not rushed into new positions. Instead, it was layered into MSTY through staggered buys, reinforcing an existing conviction rather than initiating risk. This disciplined deployment allowed the portfolio to scale exposure without overreaching.
Liquidity levels were supported without compromising allocation principles. The portfolio grew not by force, but by focus.
This deposit reinforced flexibility and allowed March’s strength to be captured, not chased.
Market Update
March reminded us that drawdowns do not always arrive with panic. Sometimes, they arrive with silence.
The S&P 500 fell 6.0%, its worst monthly performance since late 2022. Market breadth narrowed. Small caps and cyclicals dragged the index lower while large-cap tech slowed but did not break.
The VIX spiked above 30 mid-month, closing at 22.28 on March 31. This surge did not translate into healthy premium opportunities. Option markets remained structurally weak, offering little reward for taking directional risk.
Bitcoin (BTC) slipped 2.2%, closing at $82,548.91. The decline was milder than February’s collapse but signaled a continued loss of momentum.
MicroStrategy (MSTR) fell 1.7%, holding slightly firmer than BTC but not enough to reverse the drag on MSTY’s NAV correlation thesis.
MSTY, despite the crypto stabilization, posted only a 0.1% return, suggesting that option decay and volatility compression continue to weigh on its income-driven structure.
This was not a trader’s market. It was a watcher’s environment. For income strategies dependent on volatility and premium flow, March offered more restraint than opportunity.
Why This Matters:
Because not trading is still a decision.
March exposed a critical truth: elevated volatility does not guarantee elevated opportunity. The VIX surged, but option premiums stayed subdued. Bitcoin stabilized, but MSTY barely moved. And the S&P fell 6%, gutting broad equity sentiment while leaving income strategies stranded between caution and compression.
This matters because too many portfolios confuse volatility with action. But in March, doing nothing was the right move. No CSPs were written. No calls were forced. Capital was preserved. Discipline held.
It also matters because MSTY’s flat performance, despite BTC’s relative resilience, challenges its short-term thesis. The yield engine may be intact, but its responsiveness is not. Meanwhile, YMAX and CONY continued to bleed, quietly but consistently.
This was a month that punished reach. And it asked a difficult but necessary question: What happens when the income dries up, but the drawdowns don’t?
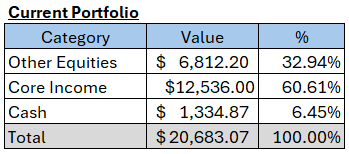
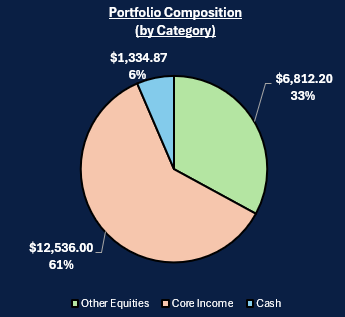
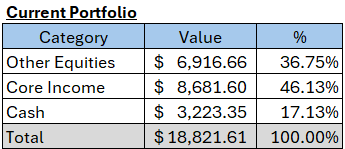
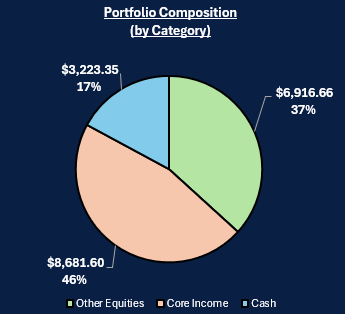
Portfolio Snapshot (31 Mar 2025)
March closed with a portfolio NAV of $20,683.07, a +9.9% rebound from February’s close of $18,821.61. The recovery was not driven by premiums or capital injections, but from a selective rotation into MSTY and broader market stabilization.
The cash balance stood at $1,333.71 or 6.45% of NAV, down from 17% the month prior. The decline was expected, the result of targeted MSTY accumulation.
Core exposures remained concentrated in YieldMax strategies: • MSTY was scaled to 400 shares, becoming the portfolio’s anchor. • CONY and YMAX positions were held constant but continued to underdelivery on both capital and income fronts.
Despite a lack of new premiums, total income remained strong, powered entirely by dividends. No trades were forced, and the portfolio stayed within mandate across all metrics.
🟢 Core Income: + 44.4%
YieldMax positions (MSTY, CONY, YMAX) surged from $8,681.60 to $12,536.00, marking a +44.4% increase in total value. This sharp rebound was almost entirely powered by MSTY, which rose over 150% following a disciplined cost averaging strategy.
MSTY and CONY now comprise 89% of core ETF exposure, increasing concentration risk.
📉 Other Equities: – 1.5%
Non-core holdings slid from $6,916.66 to $6,812.20, reflecting a quiet 1.5% decline. No rebalancing occurred in this segment, and no new positions were introduced. Performance here remains muted and unrewarded.
💵 Cash Position: Restored
Cash fell from $3,223.35 to $1,334.87 as MSTY accumulation continued. While still above emergency thresholds, liquidity now accounts for only 6.45% of NAV.
🧭 Takeaway
The portfolio leans harder into MSTY than ever before. If it outperforms, this pays. If it stalls, risk concentration becomes a liability.
The structure now carries three familiar forces: • Conviction : MSTY is doing the heavy lifting
• Drag : From legacy positions still under review
• Flexibility : Reduced but intact. The question ahead isn’t whether the rebound was real. It’s whether it’s repeatable and sustainable.
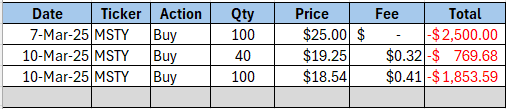
Key Transactions
• Equity Buys
• Cash-Secured Puts
No option trades were executed.
Core Income Position Total Return Analysis
March saw limited improvement in price return across YieldMax positions, despite broader NAV recovery. The total unrealized loss of nearly $5,000 reflects long-held positions struggling to recover their cost basis:
MSTY: Decline narrowed thanks to timely cost-averaging, but still negative.
CONY: Continued collapse amid meme-stock volatility and zero option income.
YMAX: Further erosion despite monthly payouts, weakening its value proposition.
Income alone cannot offset persistent capital drawdowns. For any strategy to remain viable, it must demonstrate resilience on both sides of the ledger (payouts and preservation).
🧠 Key Takeaways
NAV Rebound, but Core Still Below Water. The portfolio rose +9.9%, recovering some of February’s losses. But the recovery was uneven. MSTY led the charge with a 152.7% surge in market value (due to increased allocation), while CONY and YMAX slipped again. Core NAVs remain down -28.5% overall.
Dividend Engine Held the Line Despite no premiums sold, $597.13 was collected in dividends. MSTY contributed $385.70, delivering a 3.4% yield for March. This proves that income did not collapse, even as capital wavered.
Options Remained on Ice Volatility rose, but premiums didn’t follow. No calls or CSPs were executed, preserving downside protection but missing upside potential. Patience was prudent, but future income will depend on re-entry discipline.
CONY and YMAX Are in the Spotlight With yields at 2.8% and 0.3% respectively, and continued NAV erosion, these names are now weighing on performance. A case for trimming or replacing them is building.
Cash Cushion Shrinking Cash fell to 6.45% of NAV, down from 17% last month. While the MSTY cost-average was well timed, future moves must be balanced with restoring liquidity.
🎯 What This Means Going Forward
March showed that patience compounds, but only if it is backed by clarity.
The portfolio rebounded without leaning on risky repositioning or overextended trades. This reinforces the value of measured accumulation and avoiding forced action when premiums don’t justify the exposure.
But the deeper lesson is this:
Yield is not enough if capital erosion continues.
Conviction must be earned, not inherited from past strategy.
And cash must be rebuilt, not spent to chase.
With MSTY now anchoring over 65% of core income exposure, portfolio beta is rising. That’s acceptable if future volatility is harnessed through disciplined options selling. But it also means the bar for new trades is higher.
Looking ahead:
Premiums must clear thresholds. No more passive collection for passive’s sake.
Underperformers like CONY and YMAX face review. Their income is no longer enough to justify persistent NAV drag.
Liquidity matters more than ever. A 6.45% buffer offers little margin in volatile conditions.
April is not about reactivity but about refinement. The goal now isn’t recovery. It’s repeatability.
Lessons Learned
Buying Low hurts until It Doesn’t MSTY was cost-averaged into weakness. The result was a higher position size and a lower blended entry, but it still sits in the red. Timing wasn’t perfect. But conviction, executed with discipline, laid the groundwork for future recovery.
Yield Without Cushion Is Dangerous CONY and YMAX continued to bleed despite paying consistent dividends. Yield helps soften the blow, but it doesn’t erase structural weakness. A 3% yield means little when NAV drops 10% or more in a month.
Inaction Can Be an Edge No CSPs were sold. No covered calls were chased. And that restraint protected capital when premiums didn’t match the risk. Sometimes the best trade is no trade at all — especially in environments where VIX and IV decouple.
Liquidity = Optionality A reduced cash buffer feels limiting, but every dollar unspent in March was a future opportunity preserved. Rebuilding the war chest is not about fear, it’s about flexibility.
Pain Without a Plan Is Just Punishment This month wasn’t easy. Every decision (or non-decision) was made with a clear strategy in mind. And that’s what separates regret from refinement.
Month 7 Objectives
Rebuild the Cash Buffer Target restoring cash to 10% of portfolio NAV. With MSTY scaled and no immediate catalysts, capital preservation takes priority. Avoid new buys unless outsized value appears.
Reassess Underperformers YMAX and CONY remain deep in the red. Both lag on price and yield. Begin preparing exit strategies or replacement candidates. Dead weight drags more in quiet markets.
Stay Selective With Options Do not force trades. Reenter CSPs only if: • IV exceeds 25% • Premium > 2.5% of collateral • No conflict with MSTY exposure Focus only on high-conviction tickers, ideally MSTY if premiums improve or new short-term volatility appears.
Monitor BTC-MSTY Correlation MSTY’s link to BTC remains tenuous. A renewed divergence may signal deeper issues with responsiveness. If BTC rallies but MSTY stalls, prepare to trim.
Income Target: $400+ Maintain steady income flow through dividends. Only supplement with options if risk-reward profile is clearly favorable. Let existing positions work.
Final Thoughts
March was not about glory. It was about grit.
The portfolio didn’t roar back through leverage or luck, but through calm execution. A disciplined cost-average into MSTY paid quiet dividends, even as the broader market sold off. No premiums were harvested, yet over $580 in passive income was banked. That is the kind of month income portfolios should aspire toward. One built on patience, not panic.
There are still cracks. YMAX and CONY remain stubborn underperformers. Cash reserves are low. And MSTY’s correlation to BTC continues to drift. But compared to February’s fragility, the structure now feels sounder.
Success in this strategy isn’t about chasing every bounce. It’s about keeping the machine intact long enough for the compounding to show.
Let’s Talk
As the dust settles from a volatile quarter, I want to hear from you:
What do you do when the premiums vanish? Do you sit out, rotate, or double down?
Are you holding any income ETFs that feel more like dead weight than anchors? How are you managing them?
If you had to cut one position tomorrow, which would it be and why?
Share your thoughts in the comments. Let’s build better portfolios together, one honest review at a time.
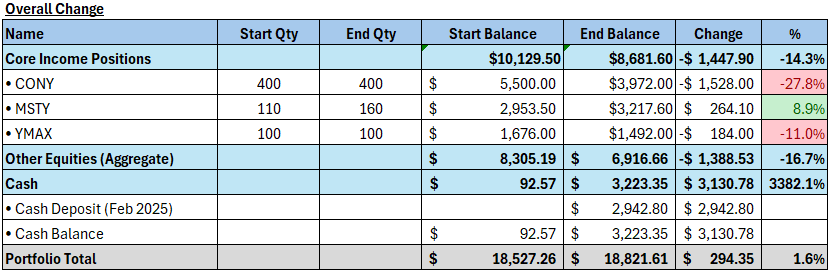
February demanded discipline at every turn. The portfolio’s NAV plunged 14.3%, falling from $18,527.26 to $15,878.81. A $2,942.80 cash infusion lifted headline NAV to $18,821.61 (+1.6%), but the optics of growth masked the truth: that asset performance was decisively negative.
Losses were broad, but especially sharp in high-volatility strategies: • Bitcoin : Dropped $102,405 to $84,373 (-17.6%), derailing MSTY’s leveraged correlation thesis. • YieldMax NAV declines across the board reflected growing pressure on underlying equities. • MSTY : $17.16 to $14.84 (-13.5%). • CONY : $13.00 to $9.93(-23.6%). • YMAX : $16.17 to $14.92 (-7.7%). CONY was gutted by meme stock dislocation, MSTY buckled under Microstrategy’s beta risk. Even YMAX, the portfolio’s ballast, failed to provide cover.
This month was a stress test, and the lesson is clear. Capital contributions can mask drawdowns, but they can’t fix bad positioning. YieldMax income comes with equity exposure, and February made the cost of that exposure brutally clear.
Month 5 Objective Review
We entered February with 4 non-negotiable targets. Liquidity, disciplined puts, metric overhaul and a $400 income goal. Here’s the harsh truth on each:
✅ Rebuild Liquidity – Met February ended with $3,223.35 in cash, representing 17% of the total portfolio value, up from the near-zero in January. Liquidity was not just restored, it was fortified. A small purchase of 50 MSTY shares was executed as a controlled reallocation, not a breach of mandate.
This cash buffer restores optionality, a critical edge when volatility spikes or opportunity knocks.
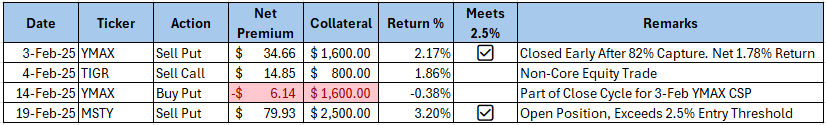
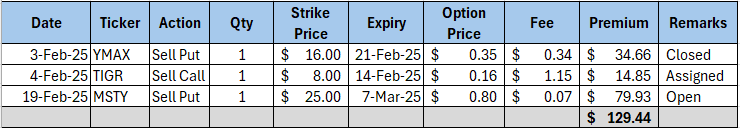
⚠️ Disciplined Puts – Mostly Achieved. Cash Secured Puts (CSPs) were deployed selectively and aligned with the portfolio’s 2.00% premium threshold. Two trades were executed on core income funds: • YMAX CSP (Feb 3): Closed early at 82% premium capture, delivering a net 1.78% return. • MSTY CSP (Feb 19): Remains open, entered at 3.20% return, well above target.
Total net premium collected: $108.45, excluding TIGR, which is classified as a non-core equity and included for completeness only. The discipline was sound. Execution was tight. But realized returns proved vulnerable to early exits and premium decay. As such, the CSP entry threshold will be raised from 2.00% to 2.50%, targeting a minimum 1.75% net return after partial premium capture. Fewer. Cleaner. Better.
🔍BTC – MSTR Divergence – No Action Taken The thesis entering February was clear. If Bitcoin rallied without confirmation from MSTR, MSTY exposure would be trimmed. What happened instead was worse. BTC collapsed, and MSTR collapsed harder. • Bitcoin : $102,405 → $84,373 (-17.6%) • MSTR (proxy): Underperformed even relative to BTC’s drop (-17.6%) • MSTY NAV : Down 13.5%, with no bounce on BTC’s brief rebounds
The divergence thesis was confirmed, yet no positions were trimmed.
Whether due to hesitation, attachment bias, or unwillingness to crystallize losses, the inaction speaks louder than any signal. The result was a compounded drawdown, with MSTY dragging the portfolio deeper just as its structural link to BTC broke down.
Sometimes the hardest trades are exits. February showed that knowing when to sell is just as vital as knowing when to stay out.
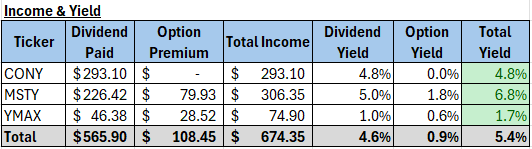
✅ Income Target $400 – Exceeded The portfolio set a February income target of $400. Actual results came in well above expectations, with $674.35 in total income (68% outperformance). This includes: • Dividends: $565.90 • Option Premiums: $108.45 • Total Income: $674.35
MSTY led the pack with a 6.8% blended yield, proving the case for selective CSP deployment. CONY offered a high baseline dividend without option activity, while YMAX trailed on both fronts—raising questions about its longer-term role.
This wasn’t just a win. It was a proof point. YieldMax funds, when timed and structured correctly, can deliver powerful cash flow even during capital drawdowns. The challenge now is to preserve the income engine without bleeding NAV in the process.
Deposits
Total Cash Deposit – $2,942.80
A total of $2,942.80 was deposited in February. This was not a rescue. It was a rearmament.
The deposit restored cash levels to 17% of total NAV, reversing the near-zero balance seen in January. It was timed deliberately, not to chase trades, but to rebuild optionality after weeks of constrained flexibility.
This move unlocked strategic breathing room, enabling controlled trades like the MSTY CSP and positioning for future volatility spikes.
Discipline doesn’t always mean standing still. In February, it meant reloading without overreaching.
The S&P 500 fell 1.0% for the month, despite closing sharply higher on February 28 as investors shrugged off a heated exchange between Trump and Zelensky. Market breadth improved, but large caps continued to dominate gains, masking deterioration underneath.
In crypto, the damage was more direct. Bitcoin plunged 17.6%, falling from $102,405 to $84,373 as ETF momentum stalled and macro sentiment weakened. MicroStrategy lagged even further, intensifying the drag on MSTY and decoupling from BTC entirely.
The VIX declined modestly, opening at 20.36 and closing at 19.63. But this drop in headline volatility did not translate into premium expansion. Instead, implied volatility across YieldMax ETFs remained muted, choking off option yields just as NAVs declined.
This month was a grind down. For income-driven portfolios, February showed that capital can erode even when vol stays elevated, if the structure stops paying.
Why This Matters:
Because income without control is just exposure.
February wasn’t catastrophic. It was revealing. The portfolio delivered over $674 in income, but at the cost of double-digit NAV decline. Yields held up, but capital didn’t. And that breaks the unspoken rule of income investing: payouts must never outrun resilience.
The problem wasn’t just market direction, it was structural fragility: • Volatility compression killed premiums right when drawdowns hit. • Correlation breakdowns (BTC vs MSTR, meme stock reversals) exposed overconcentration risk. • And strategy drift, surfaced in moments of hesitation, not action.
This month mattered because it asked a hard question: Can the portfolio survive multiple months like this and still compound?
If the answer isn’t a confident yes, then the structure needs rethinking. The good news? Liquidity was restored. Trade discipline mostly held. And the income engine still runs.
Now it needs armor.
Portfolio Snapshot (28 Feb 2025)
As of February 29, 2025, the portfolio stood at $18,821.61, up 1.6% from January’s close. That increase was entirely funded by a $2,942.80 cash deposit. Without it, performance would have shown a net loss, making February a month of erosion disguised as growth.
🔻 Core Income: – 14.3%
The YieldMax suite (CONY, MSTY, and YMAX) fell from $10,129.50 to $8,681.60, a drawdown of 14.3%. This erosion came despite regular income distributions.
MSTY and CONY now comprise 83% of core ETF exposure, increasing concentration risk.
📉 Other Equities: – 16.7%
Non-core holdings declined from $8,305.19 to $6,916.66, losing 16.7% in value. No trades were executed in this category during February. The drawdown reflects passive exposure to underperforming names without offsetting premium collection.
💵 Cash Position: Restored
Cash rose from $92.57 to $3,223.35, solely due to the February capital injection. This lifted cash to 17% of total NAV, restoring flexibility after January’s liquidity choke.
Core income remains the portfolio’s anchor, but cash has returned as a meaningful third pillar.
Takeaway
The income engine delivered, but the cost was clear. NAV decay was systemic, not isolated. With nearly half the portfolio tied to YieldMax ETFs, the structural risks became visible. The current allocation offers three things:
• Yield : From income ETFs
• Liquidity : In the form of cash
• Drag : from unadjusted equity exposure With liquidity restored, the question is no longer “what can be done?” but “what should be cut?”
Key Transactions
• Equity Buys
• Cash-Secured Puts
Note
• No new CSPs were written on speculative equities. • TIGR trade excluded from core analysis due to non-core classification. • Transactions were sparse, preserving liquidity and avoiding overreach during volatility compression.
Core Income Position Total Return Analysis
Cash flow matters. But capital preservation matters more. The portfolio’s three YieldMax positions (CONY, MSTY, and YMAX) continue to generate income, but the cumulative price damage now exposes a deeper truth. negative compounding is alive and well.
🧠 Key Takeaways
• Yield ≠ Return: All three ETFs have paid monthly distributions, but none have preserved capital. • CONY delivered the worst absolute and % loss, offsetting any advantage from higher dividend yield. • MSTY remains more defendable due to CSPs, but its underlying beta exposure remains a risk. • YMAX appears most stable. But even here, a nearly 20% draw shows there is no “safe” income play when volatility compresses.
Still, income didn’t flinch. Dividends across CONY, MSTY and YMAX delivered $405.71, hitting the Month 4 income goal.
🎯 What This Means Going Forward
The Core Income engine is under review. Income is still flowing, but the price yield is compounding against performance. This is not a call to panic, but it is a clear signal that position sizing, rotation, and entry levels must evolve.
Lessons Learned
February didn’t break the portfolio. It revealed its blind spots.
Yield Can Mask Fragility. Income was strong. On paper, everything worked. But capital bleed told a different story. High payouts distracted from underlying decay. Going forward, total return, not distribution size, will drive conviction.
Premium ≠ Protection. Volatility compression quietly killed the premium engine. Even when the VIX hovered near 20, implied vol on YieldMax ETFs stayed muted. This mismatch exposed positions to decay without offsetting income, a structural flaw to monitor in quiet markets.
Correlation is Not a Covenant. MSTY and CONY both decoupled from their underlying narratives. Bitcoin’s fall hurt MSTY, but MicroStrategy underperformed even further, breaking the leveraged beta thesis. CONY’s meme beta failed to rebound. In both cases, thesis erosion wasn’t met with timely trimming.
Liquidity = Optionality The February cash deposit didn’t plug holes. It created strategic breathing room. The portfolio’s ability to survive further downside now rests on its ability to act. Liquidity isn’t idle capital. It’s a stored decision.
Discipline held, but structure cracked. February proved that yield without resilience is a liability. The engine runs. But now, it needs armor.
Month 5 Objectives
Protect Capital. No new equity purchases unless cash buffer remains above 12% NAV post-trade. Position trims will be triggered if total return remains negative after next distribution.
Income Target: $400 Target remains unchanged. However:
Options must exceed 2.50% entry yield
Early exits only allowed if >75% premium is captured with <50% time remaining
Income mix target: ≥70% from core CSPs, ≤30% from tactical outliers
Reduce CONY Exposure CONY faces automatic trim if March NAV fails to hold above $10 post-dividend. Reallocation will favor MSTY only if BTC correlation reasserts.
Preserve Liquidity Maintain minimum $2,000 cash buffer at all times. Any CSP assignment must be pre-approved by cash reserve thresholds.
March is not for expansion. It’s for fortification. The portfolio can still compound,but only if each trade earns its place.
Final Thoughts
February was not the storm. It was the undertow.
The portfolio didn’t crash, it cracked. NAV fell. Structure leaked. And income, while impressive, couldn’t mask the fragility underneath. That’s the reality of yield-based strategies in low-volatility markets: the pain isn’t loud, it’s cumulative.
But this month also marked a pivot. Liquidity was restored. Execution tightened. And the first real total return audit surfaced what needs fixing.
The lesson isn’t to chase. It’s to refine. In March, every trade must earn its risk. Every dollar must prove its place. That’s the mandate now: not growth for its own sake, but growth that survives itself..
Follow the Yield
If this breakdown challenged your thinking or sharpened your edge, follow along for the next chapter.
Is your portfolio structured to survive multiple losing months without needing a deposit?
Are you measuring return by what you’re paid, or by what you’re left with?
Which of your positions would you still own if they stopped paying for 60 days?
Stay connected. Watch how this strategy evolves. And if you are building yield too, share your progress.
The markets won’t wait. Neither should your strategy.
January moved like a low tide, pulling back the market’s bravado and revealing bare conviction. Prices slipped, Red ink bled, and Volatility sank, exposing portfolios to quiet pressure. But even in its sharpest unrealized loss yet, the truth held: Income never wavered.
It took hits, It stood. It held the line. Not by timing markets, but by trusting in yield. No glamour just grit.
Month 4 Objective Review
Deploy $3,000 across core ETFs
$2,459.64 deployed (~82% of Target)
Income target of $400 in dividends and option premiums
$405.71 earned (~101% of Target)
Maintain 10 – 12 % of portfolio in cash for assignments, and dip buys.
$92.57 cash at month end (~0.5%)
The ETF buys came in below target, which (in hindsight) helped preserve some cash at a time when liquidity proved critical.
Income met its goal, but the cash buffer closed dangerously thin. With only 0.5% in reserve, February begins with limited room to maneuver until the next deposit.
The next move isn’t more exposure. It’s about rebuilding control.
Deposits
Total Cash Deposit – $3,119.52
This injection anchored January’s capital deployment. While most of it funded MSTY and CSPX allocations, it also helped sustain the portfolio’s momentum without risking forced liquidations. Moving forward, deposit pacing will need to align more tightly with buffer preservation and not just equity growth. The margin for error narrows, when the well runs dry.
Market Update
The S&P 500 rose 2.33% supported by mega-cap tech and broad market strength.
Federal Reserve held rates at 4.25 – 4.50% maintaining a cautious, data dependent stance in Jan 2025
BTC closed at $102,405 up 9.6% but with fading momentum..
The CBOE Volatility Index ended at 16.43 reflecting moderate calm but not record lows.
Implied volatility remained muted across most ETFs, limiting option premium potential.
Market breadth improved, though large cap led gains disproportionately.
Why This Matters:
Despite the strength in risk assets, premiums stayed weak. Volatility dropped, leaving little edge in option selling across the core income ETFs. MSTY trailed BTC, weighed down by low MSTR correlation and compressed IV. With no trades worth writing, dividends did all the heavy lifting. January proved that doing less is more.
While BTC surged behind the scenes, silence ruled the room.
As S&P and Gold slept, volatility slipped out the back.
Portfolio Snapshot (31 Jan 2025)
The portfolio ended January 2025 at $18,527.26 marking a strong +26% month-on-month gain. The surge was powered by a decisive MSTY accumulation, modest equity recovery and robust dividend footing.
But beneath the surface, price action whispered a different story..
All 3 ETFs (CONY, MSTY, YMAX) closed in the red on a price basis.
Unrealized losses totaling – $973.54, even as nominal value climbed.
Total income reached $405.71, anchoring performance through yield.
Breakdown by Allocation:
CONY: 54%, Top dividend earner. Workhorse of the core.
MSTY: 29%, Capital deployed aggressively. Driver of growth, yet vulnerable to BTC lag.
YMAX at 17%, Stable, but weakest performer in both price and yield.
Cash balance scraped in at $92.57, with no room for CSP assignments and zero margin for sudden dips. Rebuilding liquidity is now the first order of business.
Key Transactions
January focused on targeted capital deployment with a strategic push into MSTY completing the core income build. Three tranches of 50, 25 and 10 shares were added at an average cost of $28.94, bringing the total position to 110 shares. This solidified MSTY’s role as the portfolio’s crypto-linked yield play. The purchase was timed during a period of low volatility and subdued sentiment in BTC.
In parallel, $1874.81 was allocated to 3 units of CSPX, a globally diversified S&P 500 ETF. While non-yielding, CSPX adds a growth oriented counterweight to the income heavy portfolio.
No options were written during the month. Low volatility across all 3 Core income ETFs offered limited premium opportunities. The focus remained on equity allocations completion.
Core Income Position Total Return Analysis
While January closed green in nominal terms, the mark-to-market (MTM) told the real story. All three income ETFs finished below cost, with unrealized losses totaling -$973.54. A visual sting, the cost of early aggressive accumulation.
Still, income didn’t flinch. Dividends across CONY, MSTY and YMAX delivered $405.71, hitting the Month 4 income goal.
Why This Matters:
In low IV, yield becomes the anchor. No CSPs written, nor CCs filled. Premiums were absent, yet cash still came in. Passive, Persistent, Protective. This is why we built core.
Lessons Learned
January’s red close wasn’t just numbers. It was a reminder that prices fall, sentiments sour, but if the structure is sound, income still flows.
Aggression without reserves invites fragility. MSTY’s rapid scaling burned through cash. Without a buffer, the portfolio became rigid, unable to pivot or defend.
Yield shields, but doesn’t insulate. Dividends held the line, but couldn’t reverse the mark-to-market losses. Yield is ballast, not armor.
Low IV punishes the impatient. With premiums thin, forced trades become costly. Waiting instead, becomes the most profitable strategy.
The portfolio survived the test, albeit roughed up a little. February’s priority is not more buying, but about regaining flexibility and restoring reserves. Only then can we press forward.
Month 5 Objectives
Rebuild Liquidity No new equity buys unless buffer exceeds 10% of portfolio. Cash is the oxygen of options and January nearly choked it dry. Top priority is rebuilding flexibility.
Selective Option Selling Target CSPs on MSTY only if IV rises and premium exceeds 2% return on collateral. No forced trades. Wait for the setup.
Monitor BTC – MSTR Divergence MSTY’s decoupling from BTC weakens its short term thesis. A sharp BTC rally without MSTR follow through is a red flag. Trim if divergence worsens.
Income Target $400 Same goal. Let current positions work the yield engine.
Final Thoughts
January was a stress test, and the system held. Not without a few bruises, but without breaking. The month reminded us that momentum can mask fragility, and liquidity is a lifeline, not a luxury. Even as premiums dried and prices slipped, income endured. That resilience wasn’t luck. It was by design.
February isn’t about reaching further. It’s about resetting the base. Restoring cash, refining focus, and waiting for volatility to return. The core stays intact. The mission stays unchanged.
Yield leads. Patience pays. Let’s move forward, but only when the ground is firm.
Take the Next Step
If this breakdown helped sharpen your thinking, consider doing the same for your own portfolio.
Review your income positions. Are they working as intended?
Check your liquidity. Do you have a buffer, or are you over-extended?
Track your income. Yield isn’t passive if you’re not measuring it.
Stay connected. Watch how this strategy evolves. And if you are building yield too, share your progress.
This journey isn’t about chasing gains. it’s about building staying power. Let’s keep going – wisely.
Bitcoin’s roller-coaster ride has always been riveting. The current twists of 2024 and early 2025 have once again brought a new level of drama. From political showdowns and economic tremors to heated environmental debates, Bitcoin has remained the center of global financial attention. Its resilience? Unmatched.
Strap in as we breakdown the sparks that flew and the flames that forged bitcoin’s current shape.
The 2024 Bitcoin Halving: A Slow-Burn Fireworks Show
The fourth Bitcoin halving arrived on April 20, 2024. Unlike previous cycles, it came quietly. No sudden breakout. No frenzy. And definitely no moonshot.
This wasn’t what most expected. The familiar script had been written months in advance. Cut supply, trigger scarcity, watch the price skyrocket. But the market refused to follow the plot.
Instead of fireworks, we got a smoldering fuse. One that took months to ignite.
Before the Halving: A Measured Climb
Bitcoin opened 2024 just above $42,000. By April, it had climbed to $65,000, paced by steady accumulation rather than market mania. Retail participation was limited. Institutional capital remained disciplined. Liquidity conditions stayed tight, and geopolitical risk made investors wary.
Meanwhile, regulators in the United States and Europe pushed through sweeping reforms. Custody rules, staking protocols, and stablecoin operations all came under review. Compliance replaced hype as the dominant narrative.
Investors were no longer chasing returns. They were managing risk..
The Halving: Structurally Significant, Visibly Muted
On April 20, Bitcoin’s block reward fell from 6.25 to 3.125 BTC per block. This instantly halved the rate of new supply entering the market. Miner revenue dropped. Yet the price barely moved. Volatility fell. Trading volume stayed consistent. It was a clear sign that the halving had already been priced in.
Underneath the surface, however, the shift was real. Bitcoin’s daily new issuance dropped from roughly 900 BTC to 450 BTC, reducing sell pressure by over $40 million per week. Long-term holders started accumulating more aggressively. OTC desks saw renewed interest from sovereign wealth vehicles and private banks.
The Halving: Structurally Significant, Visibly Muted
The Quiet Rally: Late 2024 to Early 2025
The real movement began in Q4 2024. Inflation returned in several emerging markets. The U.S. dollar strengthened, but real rates plateaued. Global portfolios started tilting toward alternatives.
Bitcoin climbed gradually from the mid-$60,000s to the $90,000–$100,000 range. It did so without blow-off tops, without excessive leverage, and without media euphoria. This was a rally built on capital rotation and asymmetric upside, not memes.
Price appreciation was slow, but conviction was deep.
A New Era for Bitcoin
This cycle confirmed what many long suspected. Bitcoin is no longer driven by hype cycles. It is now a macro asset, sensitive to capital flows, monetary policy, and cross-border volatility.
The halving still matters. But its effect has shifted. It is now an inflection point, not a launchpad. It constricts supply just as the global appetite for uncorrelated assets is expanding.
This slow-burn structure gives the asset durability. It reduces tail risk. And it attracts capital that is measured, long-term, and serious.
Three Investor Takeaways
1. Supply shocks work slowly. The halving did not spark a breakout. It set the stage for long-term scarcity. The effects take quarters, not days.
2. Institutional flows now shape the trend. Retail sentiment no longer drives the price. Demand comes from capital allocators with long horizons and macro theses.
3. Bitcoin is evolving. It is transitioning from an opportunistic trade to a strategic hedge against systemic fragility.
Final Thoughts
The 2024 halving did not deliver the moon. What it delivered was maturity.
Bitcoin has become a structural asset with institutional staying power. The rally may not have been immediate, but it was built on conviction, not hype. In a financial world full of noise, Bitcoin’s quiet burn may be its loudest signal yet.